
Pre-aggregated OLAP cubes, in the style of SQL Server Analysis Services, never went away. It was merely overshadowed by a slew of remarkable new technologies finding massive traction circa 2010-2012. It has not been superseded. OLAP cubes have played a key role in analytics for well over twenty years. That’s far before:
- The notion of data analytics as a science (data science) leaked out beyond the likes of think lab scientists, actuaries, and hedge fund quants.
- The cloud enabled the procurement of a wide breadth of partner and third-party datasets, enriching traditional business domain data, dramatically broadening the enterprise’s view of the world.
- Big Data and the cloud-enabled processing of massive volumes of data.
- Streaming data technologies facilitated real-time analytics.
- Companies such as Databricks presented a more than suitable platform for data scientists, in terms of performance and usability.
Those are very big developments since the peak of popularity of OLAP cubes (ca. 2000s decade), when SQL Server Analysis Services (SSAS) was the best BI game in town for non-PhDs engaging in analytics. So, it can be easy to think that pre-aggregated OLAP cubes (I’ll refer to simply as OLAP cubes or cubes henceforth) have been left behind in this modern world of analytics. However, the relevance of cubes remains, albeit obscured in the fog of the cloud war.
In this post, I will briefly cover four ways in which Smart OLAP serves the data science process. Table 1 summarizes the four methodologies. The rightmost three columns require a little explanation:
- Project Phase – The project phase where the cube is utilized. Dev means the OLAP cubes are built and used during the data science project. That is, as opposed to “Prod” which refers to cubes built and used for production purposes.
- Cube Development Expertise – Cube development is actually easy. What can make it difficult is the need for large numbers of custom-calculated measures, which can take pre-aggregated OLAP out of its comfort zone. However, these four use cases should not involve such calculations.
- Existing Production Cube – Does this method involve existing production OLAP cubes? #1utilizes existing cubes as data sources. #4 is about incorporating data science results into an existing OLAP cube. On the other hand, #2 is mostly quick and dirty cubes and #3 refers to stand-alone cubes for specific data science projects.
| Method | Caption | Project Phase | Cube Development Expertise | Existing Production Cube | |
| 1 | Highly Performant Data Source | Accelerated performance for Exploratory Data Analysis. | Dev | Beginner | Yes |
| 2 | Directionally Correct Validation from Domain Experts | There are so many ways to misinterpret requirements and data. | Dev | Intermediate | No |
| 3 | ML Model Support | Human analysts should have background information on ML models deployed with the power of influencing decisions or even making decisions. | Prod | Beginner through advanced – depending on options. | No |
| 4 | Productionizing ML Models | Merging of traditional business domain data accelerated in an OLAP cube with the results of ML models. | Prod | Intermediate | Yes |
Table 1 – The Four Methods for the involvement of OLAP cubes in Data Science Projects.
None of the methods require deep knowledge of OLAP cubes for the folks building the cubes. The cubes for #2 will be fairly straightforward, with no complicated calculations. They can be built from one big file (OBF), a star schema, or a loose collection of relatable datasets. For method #4, implementation is eased with a repeatable pattern I will discuss in a follow-up post.
Methods #1 and #4 assume the existence of traditional business domain OLAP cubes in production. If there aren’t any, please refer to my blog, The Need for OLAP on the Cloud, for an overview of the current value of OLAP cubes in general. If there are existing SSAS cubes, please note that Kyvos has developed a migration tool.
OLAP cubes long ago democratized analytics to a relatively wide audience of non-technical analysts and managers with its snappy query responsiveness and a friendly semantic model. Today’s “Data Science” is the expansion and formalization of that same democratized analytics. Despite that expansion and formalization, as it was back in OLAP’s peak of popularity (again, ca. 2000s decade) , the goal is still about solving business problems.
There will always be a major role for OLAP’s core algorithm of pre-summation across massive numbers of like values. In this time of the cloud, pre-aggregated OLAP is one of the very few software-based performance acceleration methodologies. Other methods rely on faster, scalable, and thus more expensive hardware. OLAP hasn’t been superseded by big data and the cloud. It just isn’t the shiny new kid in town, but it has evolved to embrace the new technologies.
For this modern era, there is Kyvos Smart OLAP™. It is a pre-aggregation OLAP cube platform built for modern, cloud-scale volumes of data. Similar to SSAS, Kyvos Smart OLAP™ is a solution that manages how data is aggregated, optimally stored, and queried for sub-second results. It is a legitimate player in this cloud era, where performance at high scale and ease-of-use is imperative.
For SSAS fans, please see my 3-part series, SSAS to Kyvos comparison and migration to the Cloud. Additionally, for those unfamiliar with OLAP cubes, Part 1 and 2 of that series can serve as a primer for OLAP concepts.
Pre-Aggregated OLAP in the Highly Evolving World
OLAP cubes were traditionally built primarily from internal OLTP databases supporting business processes. Within a single enterprise, processes are fairly stable, slowly evolving. But when we consider all the entities an enterprise must deal with outside its walls, all experiencing their own change, it adds up to significant and constant change that cannot be ignored in the analytics process.
Thus, the modern analytics world reaches well beyond the walls of an enterprise to include data from webs of partners, third-party datasets, and event streams from the Internet of Things. Because of that extended reach, data science focuses on the discovery and measurement of relationships, not just sums and counts. That is, relationships that attempt to predict the future and automatically categorize things in fresh ways. This blog is about how OLAP fits into this expanded world of analytics.
1. Kyvos OLAP Cube as a Highly Performant Data Source
This method describes how data scientists can engage with existing business-domain cubes as they would with any other data source during the early stages of a data science project. That is, the Exploratory Data Analysis (EDA) stage. It’s a stage of brainstorming, hypothesizing, prospecting (finding data), profiling, validating the data quality, and examining its provenance (who made it, what is it made of, etc).
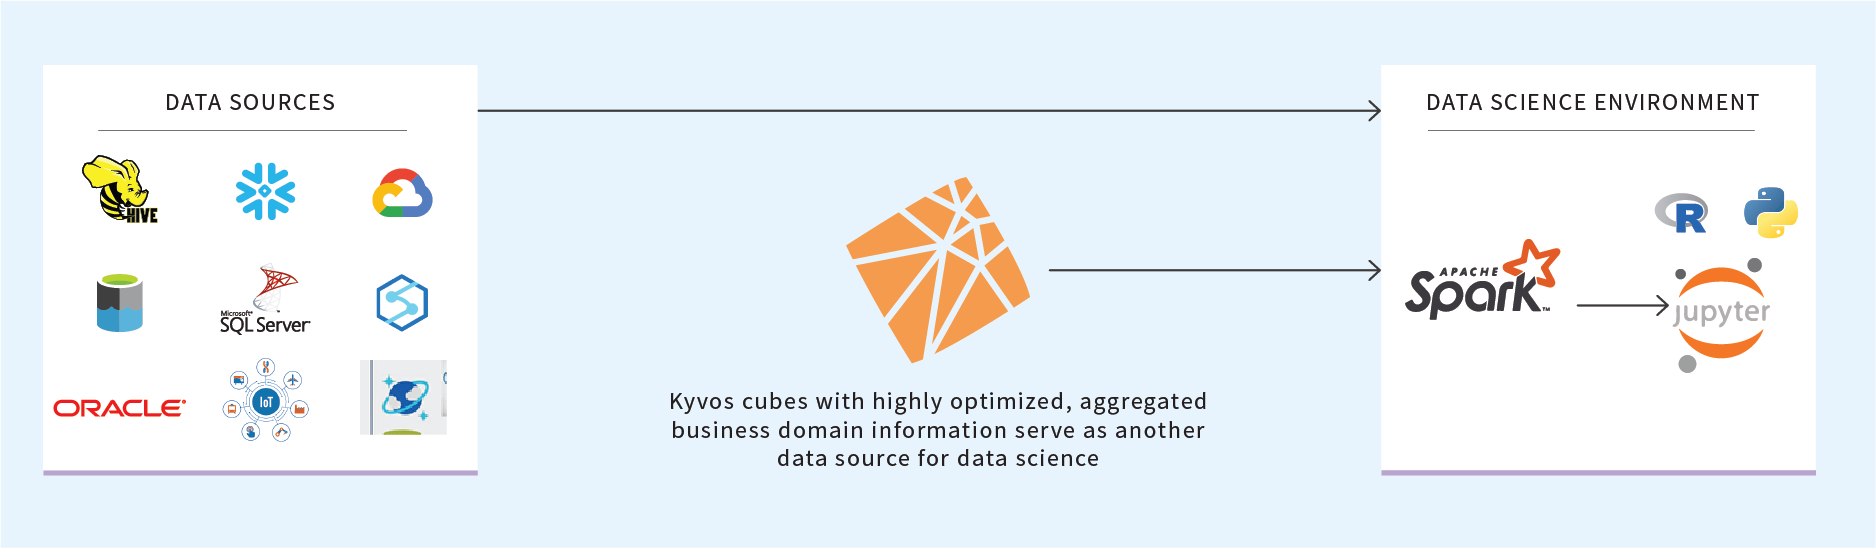
Figure 1: Kyvos as a highly performant data source delivering business-critical data
EDA is where most of the “data science” is done. Data from a variety of sources are examined, assessed for any correlative value towards the assigned business problem. This stage takes up the bulk of the time and energy of the data scientist.
At this early EDA stage, the data scientist doesn’t know exactly how to solve the business problem, or indeed whether it’s the right problem to address. Based on her data science training, past experience, and lots of common sense, she collects the “materials” to build the final product, which is one or more Machine-Learning (ML) models.
The process of creating ML models involves the mingling of data from many data sources. In this capacity, existing production cubes are just another ODBC SQL source. Yes, Kyvos speaks SQL. At the EDA stage, SQL is the primary query language. There isn’t yet the need for highly specialized Python libraries, math, or sophisticated transformations.
What sets traditional OLAP cubes apart from other data sources is that it generally represents a highly-performant, highly curated, cleansed, and validated view of relevant enterprise data. To help illustrate this value, let’s start with what challenges a data scientist, new to the environment, faces if such a cube did not exist.
The first data sources explored are usually the major enterprise databases supporting the major enterprise OLTP applications – for example, HR, SCM, CRM, etc. It makes sense since these applications are intricate parts of the business processes.
These OLTP data sources can be difficult to understand since the data is arranged in a way that is optimal to the application it underlies, not for analytics use cases. And don’t be surprised if no one in the company knows exactly what each column in the database is for. The original developers of the application might be long gone. If it’s a COTS application, the vendor often strongly discourages poking directly into that data. The DBA often doesn’t know since understanding the semantic meaning of the data isn’t her primary role.
If there are production data warehouses (DW) and/or Data Marts, folks have already gone through much of that pain of discovery faced by the newly onboarded data scientist. Teams have already gone through the pain of deciphering the esoteric meanings of data column names, mapping entities across departmental domains, ironed out terminologies, and composed calculations. We can assume that if human analysts are today working directly with the DW database on a daily basis, the semantics of the contents of a DW are well understood – as opposed to being obfuscated through the veil of the OLTP application. So the required level of effort related to data profiling, cleansing, and provenance are significantly mitigated– although one should always double-check sources anyway.
However, because DWs hold history, they can balloon into billions of rows and well beyond. To alleviate the pain of queries constantly traversing billions of rows, OLAP cubes are often built on top of the DW as an accelerated version of the highly curated DW. Equivalent queries from OLAP cubes would usually take no more than a second versus minutes or even hours from other data platforms. Additionally, compute costs from repeated queries to billions of rows adds up. Pre-aggregated OLAP cubes are process-once, read many times.
Existing business domain OLAP cubes could serve as a clean, reputable, and highly performant data source. They could be heavily queried for summary data that can be applied to feature engineering tasks. Examples of highly aggregated, business-domain queries are:
- Product totals by Customer attributes such as education, and age group could help to segment products.
- Distribution of insurance plan groups by the hospital.
- Year over Year sales by store.
Each of those examples could be added as attributes to a dataset. For example, it might be helpful to cluster doctors by their top 10 diagnoses and add that as another column of a dataset of hospital visits.
2. Kyvos OLAP Cube for Directionally Correct Validation
Data Science projects solve specific business problems. The knowledge required to solve such problems spans the expertise of many people. Therefore, a data science project involves much more than data scientists. It is a cross-functional effort that includes:
- The sponsors who are accountable for the pain the project is to resolve.
- Domain Experts who have done the actual work and know the details that very often bites a data science project in the end.
- Data Analysts who are adept at exploring data finding business-relevant insights.
- Data Engineers who do the heavy lifting – figure out how to procure data from a variety of sources, in great volumes, and utilizing a wide array of tools.
- Data Scientists who are adept with statistics and probability, ML algorithms, scientific methodology, and very robust, code-oriented tools such as Python/R languages and Python/R ML visualization libraries.
- The slew of roles usually involved with a project – project manager, architect, product owner, etc.
Frequent and consistent communication among these players is critical. However, although there is some level of knowledge overlap amongst these players, rarely do teammates speak each other’s language very fluently. For example, domain experts and data analysts tend to speak Power BI/Tableau and some SQL. Data Scientists speak Python/R ML libraries (ex: scikit learn), Spark, and very advanced SQL.
Towards the goal of ubiquitous understanding of the target business problem within the entire cross-functional team, a lowest common denominator method for communication would go a long way. Building a highly performant ad-hoc OLAP cube, explored by all team members through highly user-friendly visualization tools such as Power BI or Tableau, is a method I’ve found to be very effective.
When I engage in a project with a new customer, I’m not familiar with the intricacies of the data. From a high level and to a certain extent, “data is data”. But camouflaged in the data, often in plain sight, are countless undocumented details accumulated and compounded over years that can lead a project to failure in the end. That is, failing slow. Among other things, these details come from tribal knowledge such as:
- Clever workarounds out in the field to accommodate the limitations of the OLTP software -ex. packing a list of codes into a free-form text field.
- Undocumented changes to the semantics of data over time – ex. new pricing models, new regulations, the effects of the integration of an acquisition.
- Multiple systems with seemingly similar data with differing domain-specific semantics – ex. patients, members, employees at a health insurance company.
Building such an ad-hoc cube is in fact what I do on new projects to quickly learn about the data. I create a very simple, rough cube from the data presented to me. Nothing fancy. I’m just looking for counts and distributions, outliers, and strange values. This is still EDA. I generally share this ad-hoc cube with the rest of the team, many in the same boat as me.
In contrast, Notebooks (ex. Databricks Notebooks) can also bring the cross-functional team together in a common development platform. All team members are accommodated by the inclusion of their preferred development languages ranging from full-blown Python to SQL, to annotation/documentation markups with HTML. However, it is still rather code-intensive for most of the team. Even for a techie such as myself, as a data engineer, I don’t work with the ML and visualization libraries daily. For those who are not “coders”, all that “codiness” in a notebook just gets in the way of focusing on understanding data. In order to hash out an understanding of the data, I’d rather huddle around PowerBI/Tableau visualizations, slicing and dicing with the ease of drag and drop.
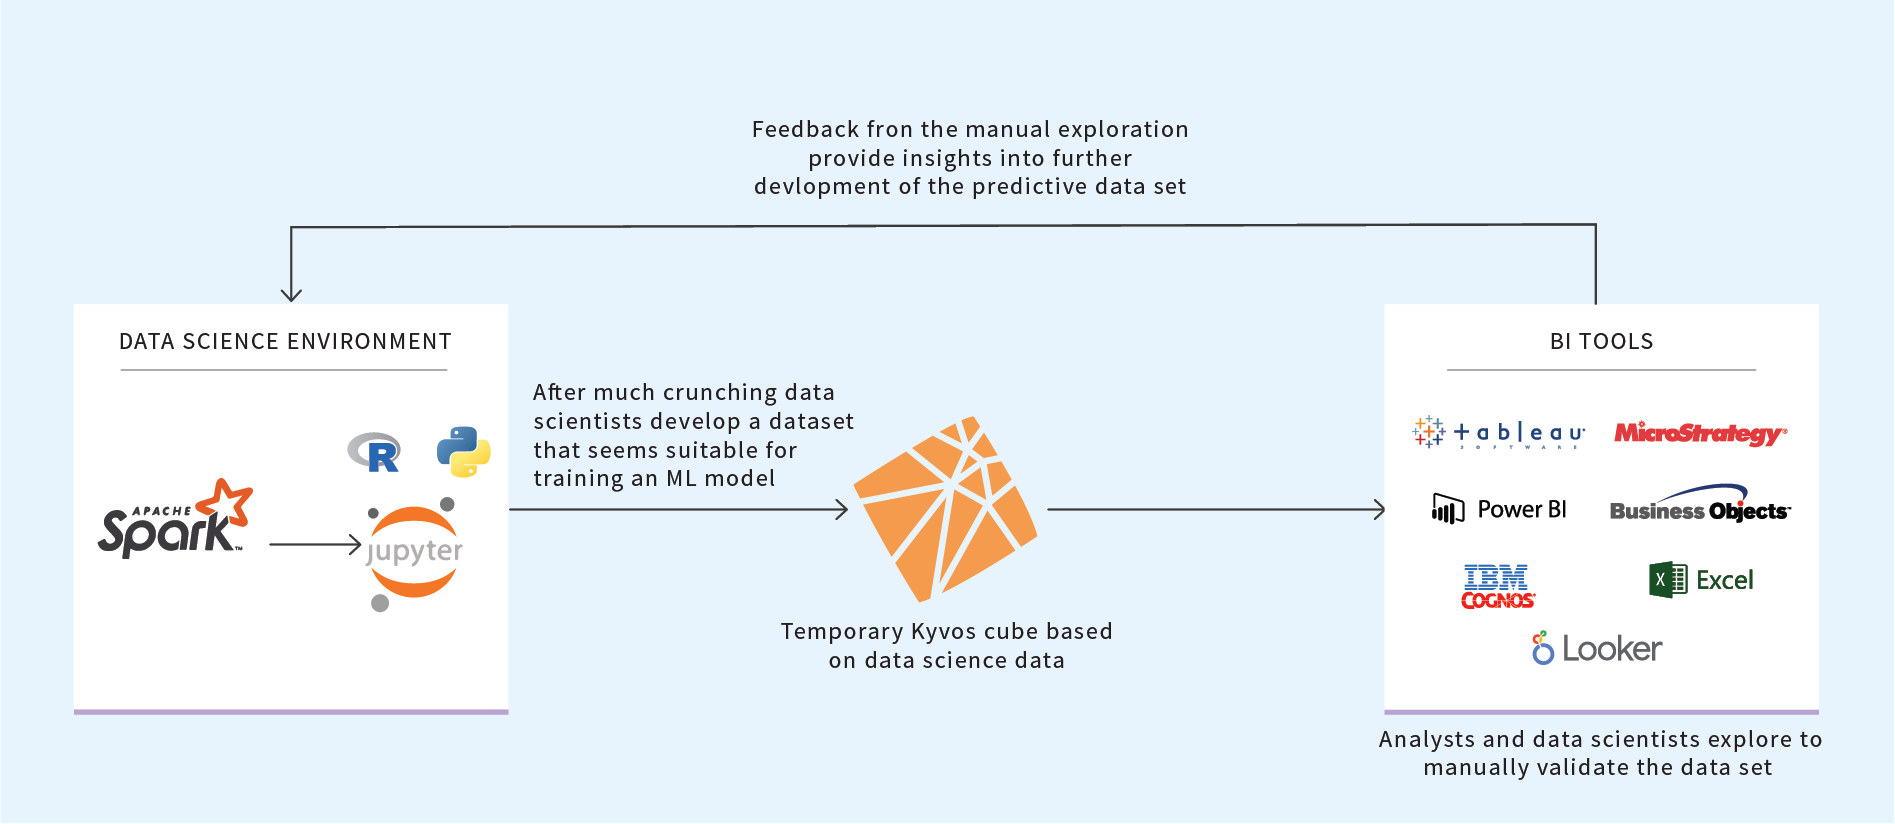
Figure 2: Temporary OLAP cubes for data profiling or deep dive analysis into a composed dataset
The cubes require time and expense to process the data into aggregations. But as long as it’s not excessive (say under one hour of processing), the value of enabling collaboration within a diverse cross-functional team as well time saved from sub-second query response times is a very sensible investment.
These cubes are intended to be informal and temporary for the most part. I mean that the purpose at this point of a project isn’t a permanent, production-quality product. Should the data be deemed un-usable, or data science project ends up unsolvable, this cube could be thrown away. However, it could serve as a start for Method 3.
3. Kyvos OLAP Cube for ML Model Support
When an ML model is deployed into production, at the least, it influences business decisions by human analysts. On the other end of the spectrum, it can make semi or fully autonomous business decisions. Therefore, these models must be monitored in the same manner as any employee “requiring supervision”.
Towards that goal, in addition to deploying the ML model into production, a few types of supporting data could be packaged and presented in an OLAP cube. These are OLAP cubes designed by Data Scientists for Business Users – as opposed to traditional cubes designed by Business Users for Business Users. In other words, this represents the wider scope of what the data scientist discovered to be important, beyond the relatively few columns that comprise the “final cut” ML model. It’s like the deleted scenes that fell on the cutting room, but still could be of value. Following are three optional types of data that could be included in such a cube.
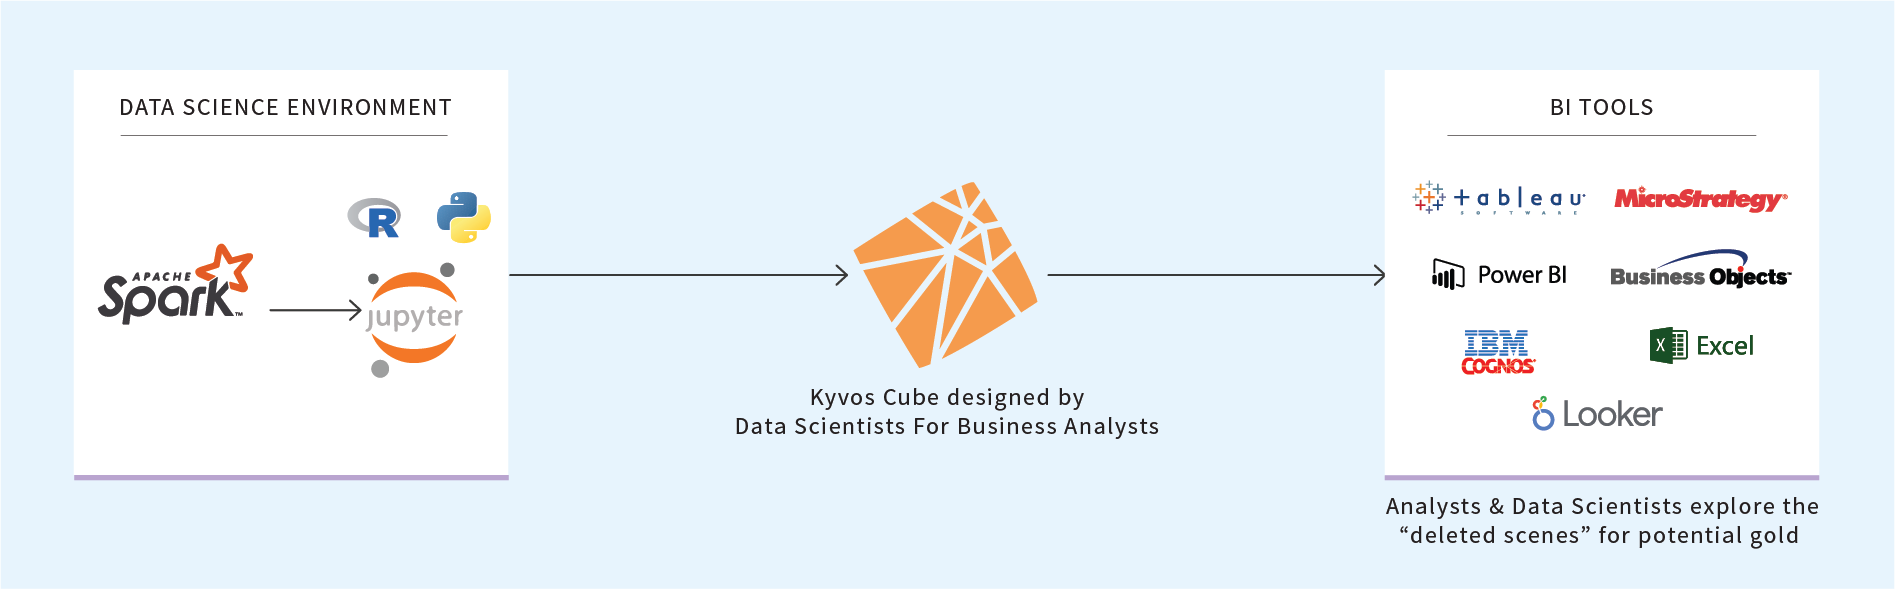
Figure 3: Model Kyvos cubes on potentially predictive data for business users
The Training and Test data for the Deployed ML Model
When the results of an ML model are being troubleshooted or simply questioned, the training and test data from which the model is formulated explains almost everything.
Data that didn’t Make the Cut but Still Holds Potential
A deployed ML model usually includes a few to a dozen features culled from what could be thousands of candidate features. The ML model deployed to production survived a Darwinian competition against other candidate models, perhaps involving very different sets of features. Even though most candidate features didn’t make it into the final ML model (or model ensemble), it could be that data involved with these runner-up models nonetheless holds valuable insights. At the least, should the current model start misbehaving, the runner-up data that the data scientist already evaluated is ready at hand for the development of alternate models.
Predicted vs Actual Values
At the simplest level, the performance of an ML model is based on correct and incorrect guesses. Because the world is constantly changing, the rules encoded in ML models undoubtedly lose validity over time. So, tracking post-deployment predictions and what actually happened is the key to detecting misbehaving ML models.
This item could require significant work. The easier part is the capture and import of predictions (along with feature values, probability, confidence, support) into the OLAP cube. But recording what actually happened could be difficult since such outcomes are often not explicitly stated in data. In fact, outcomes are often uncapturable – for example, whether a person viewing an ad eventually purchased a competitor’s product.
How much trouble one should go through to obtain actual values depends on how critical the ML model is to an enterprise. For example, an ML model for predicting customer attrition isn’t exactly mission-critical, but customer attrition still must be mitigated. For businesses where customers don’t have some type of formal contract, such as an insurance plan, figuring out the meaning of ”attrition” could be challenging, and not worth the trouble.
4. Kyvos Cube for Productionizing ML Models
Many ML models, particularly those from clustering algorithms, produce new labels for “things” such as customers and products. For example, a clustering algorithm may discover segments of customers who have several children, spending much money on sports gear, and owns two Toyota Corollas. Would this customer a good candidate for trading in the Corollas for a shiny, new minivan?
How many such potentially insightful labels discovered through ML could we assign to customers, products, vendors, or tweets? Would the characteristics, set and/or assignment of the labels change over time? Very much so. Now that the reach of our analytics data regularly extends beyond the reasonably static business processes of our enterprise, there must be a way for our analytics to reflect those changes.
As mentioned earlier, traditionally, OLAP cubes are built from data originating in business domain OLTP applications. Pre-aggregation is highly effective because the data schemas of data from OLTP applications are slowly changing. That’s because enterprise business models do not change very quickly, which is fortunate as there is already enough pain felt from just that slow rate of change! Hopefully, it changes slowly enough for human ETL developers to keep up.
But the reality is that our enterprise doesn’t exist in a vacuum. We interface with thousands to millions of customers, dozens to thousands of vendors, dozens to thousands of competitors, and in a global economy, hundreds of governments at various levels. All of these entities have minds of their own.
The results from ML models that incorporate external data represent our thumb on the pulse of what is going on outside the clean walls of the enterprise. Combining these ML model results with pre-aggregated data from traditional, business-domain OLAP cubes would offer the best of both worlds.
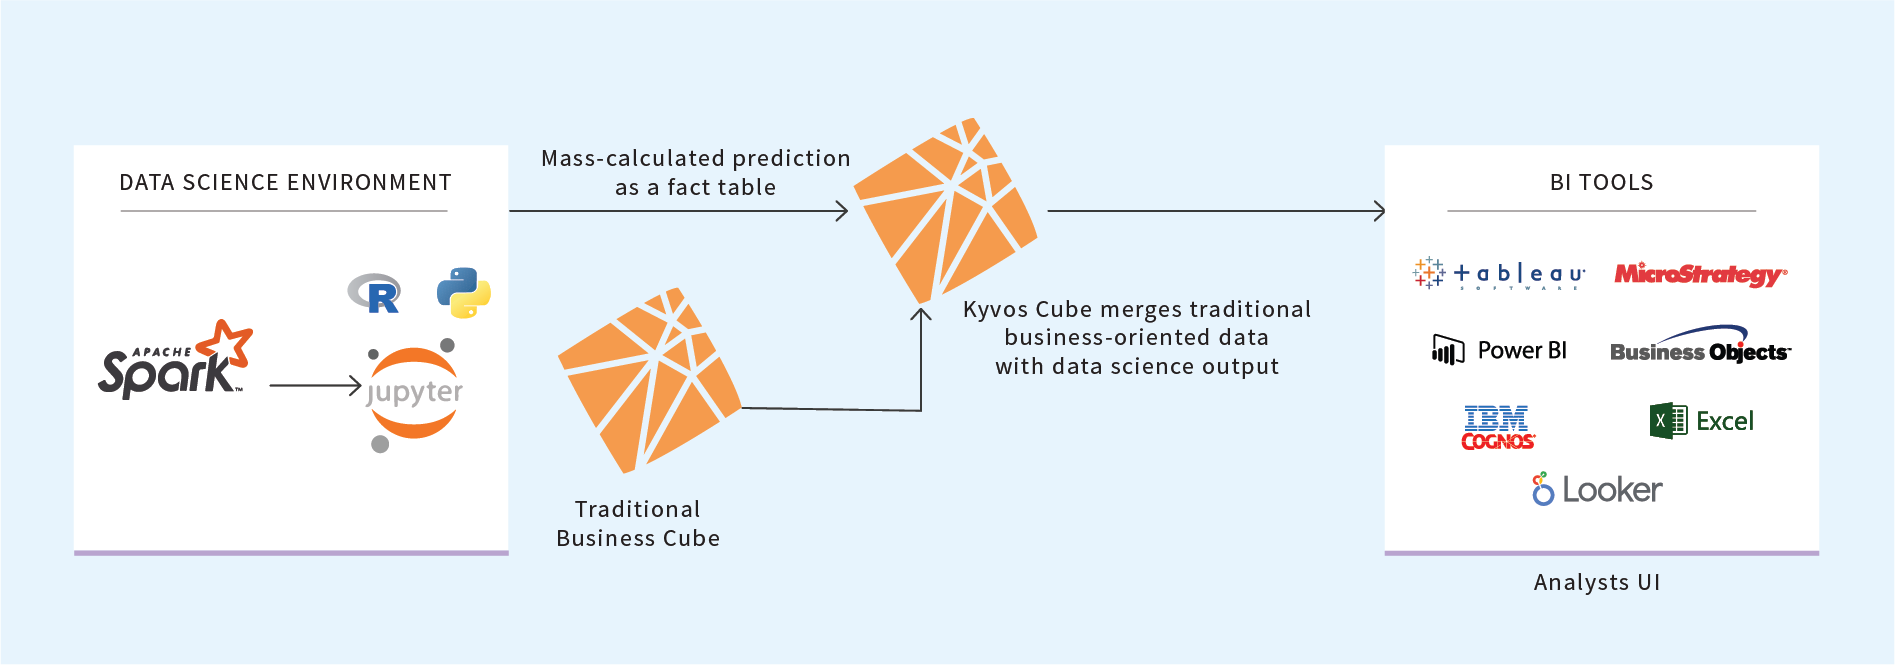
Figure 4: Integrate business cube data with materialized model outputs
As mentioned, the results of ML models are like additional labels we could attribute to customers, products, and other entities. In the world of OLAP cubes, these are like member properties. Member properties are descriptive attributes of an entity modeled into a cube, usually with no analytical value. For example, street address, email address, and driver’s license number of a customer, or the SKU of a product.
However, integrating attributes founded from a wide, diverse, and dynamic set of ML models into an OLAP cube would be messy if implemented using the current “member properties” features of most OLAP platforms. Instead of adding each ML-discovered attribute as a member property, such “properties” could be generalized into a single key/value structure I call the “Property dimension”.
Using this method, all production cases are run en masse through each ML model, and those results are stored in a table modeled into the OLAP cube. For example:
- All customers would be run through ML models such as those predicting Lifetime Value, Product Recommendations, or some sort of occupation clustering.
- The results from all those models across all customers would be saved into a table.
- Those ML Model names are added to a cube’s “Property Dimension” as another “property”.
- The ML model results are loaded into a cube’s generalized “property fact table”.
As an example of how this is used, the snapshot below shows the result of a query to an OLAP cube modeled with the Property dimension and Property Fact Table. The snapshot shows customers along with a mix of the usual aggregated values (Sales Amount) as well as a number of values from a set of ML models (Predicted Car Type through Pre-COPD).
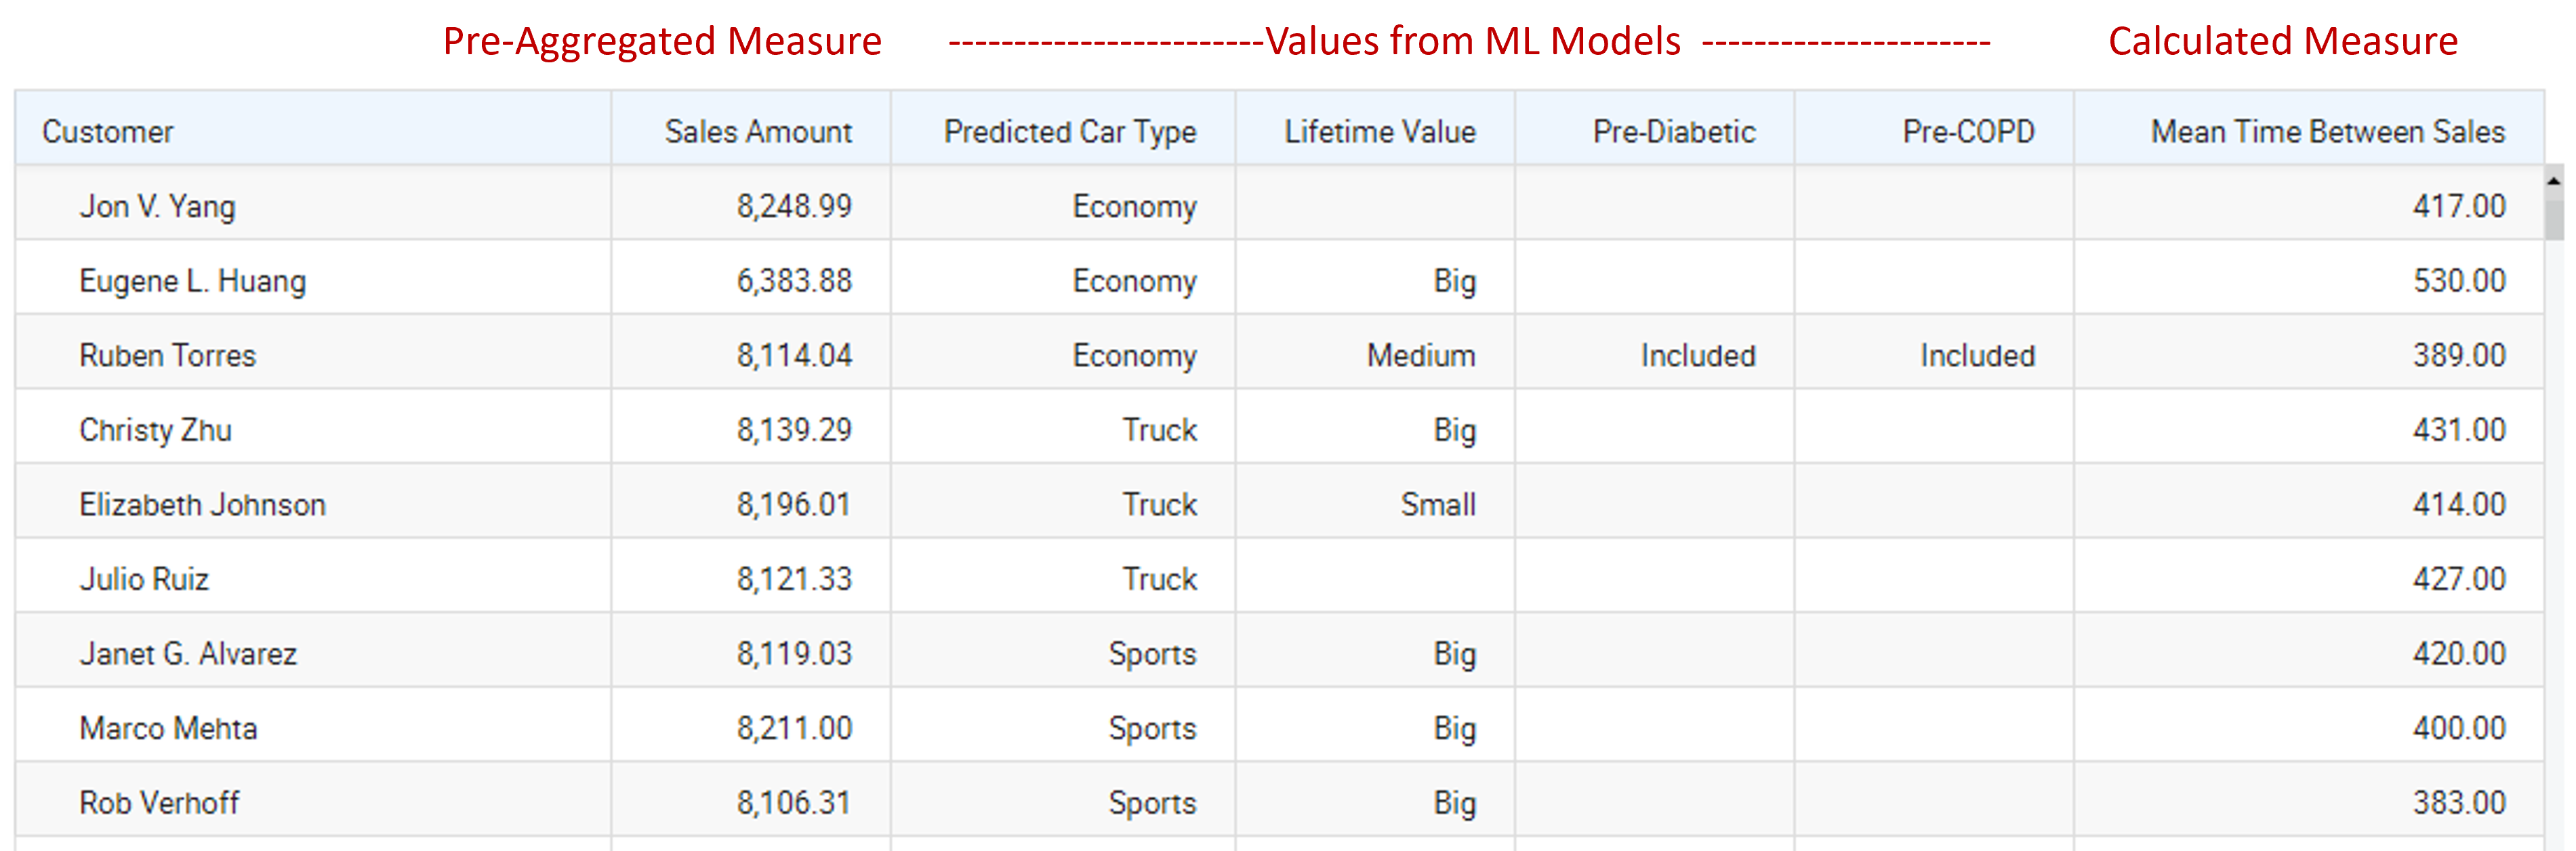
Table 2 – OLAP cube modelled with the Property dimension & Fact Table.
For a data scientist, an OLAP cube accentuated with a number of ML model predictions offers a convenient way to leverage pre-aggregated values and results from many other data science projects from a single source. Knowledge workers such as customer support agents, insurance actuaries, and market researchers could benefit from such a single source in a similar way.
Conclusion
Although this paper is about four specific ways OLAP cubes could fit into the data science process, I’d like to rephrase the contents of this blog from the perspective of a few overarching points.
- No matter how fast and scalable hardware becomes, we will somehow grow into that volume of data. We will always grow into a situation where queries take minutes or hours to run but can be improved through the compute-once and read many times algorithm of pre-aggregated OLAP. So, there will always be a place for OLAP. Even when A.I. is so smart that “Humans Need Not Apply” for any job, I’d bet my cat that it will figure out the remarkable economics of pre-aggregation.
- During the peak of SSAS’s popularity (circa 2000s), for analysts outside of the ultra-quant world of hedge funds, insurance, laboratories, etc, SSAS was the best game in town; from the perspective of performance, cost (free with SQL Server license), and ease of use. Today, the analytics process has grown up into “Data Science”. Despite data science’s 1000s of ML algorithms, mature tools, highly scalable platforms, and a proliferation of the required skillsets, then and now, the goal is to use data to solve business problems. Data Science as we know it today is the expansion and process formalization of the relatively simple business analytics democratized by SSAS around 20 years ago.
- A data scientist alone does not make a data science project. A data scientist is one specialist that emerged from that expansion and formalization of analytics to non-ultra-quant enterprises. A data science project is a cross-functional assemblage of specialists. Ubiquitous understanding amongst all members of a data science project team is key to success.
- Pre-aggregated OLAP is most effective when changes to the schema are relatively infrequent. That is the case for most optimally run businesses. However, the incorporation of a mind-boggling number of data sources outside the walls of the business enables smarter strategic changes. The mingling of highly-optimized, high-curated data of traditional OLAP cubes with the versatility of data science tools are two sides of the same coin of a perceptive analytics solution.
In the following weeks, we will post blogs diving deeper into each of these methods. If you want to learn more about how Kyvos Smart OLAP™ plays an important role in the modern, cloud-based data science process, request a demo now.
