
Building reports and dashboards that can deal with multiple currencies is vital for business intelligence applications that handle complex reporting requirements of the global market. Currency exchange rates fluctuate daily and can have a significant impact on financial analysis for any business.
The Currency Conversion Challenge
A leading global investment bank wanted to analyze billions of daily trades carried out in more than 200 different currencies so that it could assess its daily risk exposure more accurately. When their users tried to analyze these trades, they saw each transaction in a different currency, making it difficult to compare data or pull any useful insights. Dealing with currency conversions was challenging, as the volume of their daily transactions was very high. Conversions had to be quick as the business needed a consolidated view of their risks each day. Besides, they had to serve a variety of business users who wanted to see their data in different currencies.
Storing data in every possible currency combination or doing batch conversions to meet the needs of the business users was not a viable option, especially while handling the massive data.
They needed a solution that could handle currency conversions more effectively – a solution that worked on data at a massive scale.
Run-time conversions were the need of the hour.
How Kyvos Handles Currency Conversions
Kyvos uses its innovative OLAP technology to manage on-the-fly currency conversions on massive volumes of data stored on the cloud and on-premise data lakes. Its unique cubing technology delivers instant currency conversions, irrespective of the size of the data. Kyvos supports multiple currencies and provides users the flexibility to choose the currency in which they want to see data on their dashboards.
Understanding the Basics
Most currency conversion requirements depend upon the user’s needs and context. However, depending upon the exchange direction, currency conversion use cases can be categorized as follows:
- One-to-many: You have one or more measure fields, for example, Sales Amount, in USD, but your BI dashboard should toggle between multiple currencies.
- Many-to-one: Your measure fields have data in multiple currencies, but you want to standardize them to a single currency such as USD on your BI dashboard to ease comparisons.
- Many-to-many: Measure fields have data in multiple currencies, and it needs to be converted to different currencies depending upon the user’s preference.
To describe the Kyvos solution, let’s take a simple example of the many-to-many conversion. We will use the following terminology:
- Transaction Currency: The currency in which the actual transactions are stored.
- Base Currency: The currency against which exchange rates are stored in the currency master table.
- Reporting Currency: The currency to which transactions must be converted for analytics.
The daily exchange rate information is stored in a separate Currency Master table.
Below is how a typical Currency Master and Transaction table looks like:
Table Name: Currency Master Table
| Date | Base Currency | Reporting Currency | Conversion Rate |
| 30-June-2019 | USD | EURO | 000.8840 |
| 01-July-2019 | USD | EURO | 000.8861 |
| 29-June-2019 | USD | INR | 068.0825 |
| 30-June-2019 | USD | INR | 065.9405 |
| 29-June-2019 | USD | JPY | 119.5120 |
| 30-June-2019 | USD | JPY | 120.0525 |
Figure 1: Sample Currency Master Table with conversion rates from a single base currency – USD in this case
Table Name: Transaction Table
| Product | Date | Transaction Amount | Transaction Currency |
| P1 | 29-June-2019 | 10 | EUR |
| P2 | 30-June-2019 | 14 | INR |
| P3 | 01-July-2019 | 30 | EUR |
| P4 | 02-July-2019 | 50 | INR |
Figure 2: Sample Transaction Table with transactions in different currencies
Kyvos Solution
Kyvos solves the currency conversion problem by building multi-fact cubes using its innovative OLAP technology. The currency dimension behaves as a fact, and calculated measures are used for on-the-fly conversions.
Step 1: Transformation
The values in the Transaction Table need to be converted to the Base Currency before building a cube over it. For this, the Transaction Table and the Currency Master table are joined in a dataset based on Transaction Currency and Transaction Date.
Table Name: Transaction Table
| Product | Date | Transaction Amount | Transaction Currency | Amount in USD |
| P1 | 29-June-2019 | 10 | EUR | 011.3882 |
| P2 | 30-June-2019 | 14 | INR | 000.2030 |
| P3 | 01-July-2019 | 30 | EUR | 033.8562 |
| P4 | 02-July-2019 | 50 | INR | 000.7237 |
Figure 3: Join of Transaction Table and Currency Master Table
Step 2: Designing the schema
The next step is to create a multi-fact schema. As you can see in this example, two fact tables joined by a bridge dimension.
- Fact 1- Transaction Table
- Fact 2- Currency Master Table
- The two Facts have Date as a shared dimension
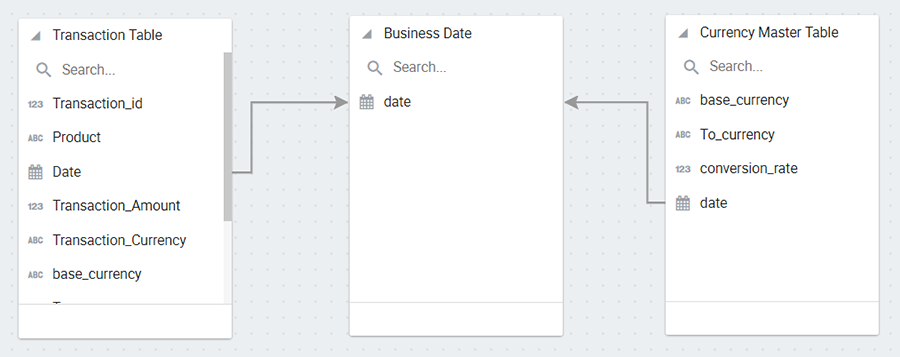
Figure 4: Sample Schema
(Facts on the right and left; Dimension in the center)
Step 3: Designing the cube
The cube is designed using the following dimensions and measures:
Dimension
- Transaction Id and Transaction Currency from the Transaction Table
- Reporting Currency from the Currency Master Table
- Date from Date dimension
Measure
- Conversion Rate from Currency Master table
- Transaction Amount and Amount in USD from Transaction Table
- Amount in Reporting Currency (Calculated Measure = Amount in USD * Conversion Rate)
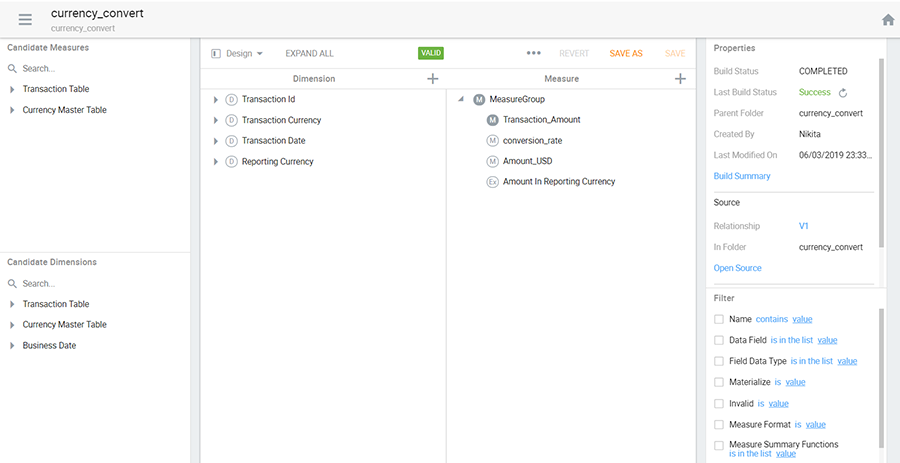
Figure 5: Sample Cube Design
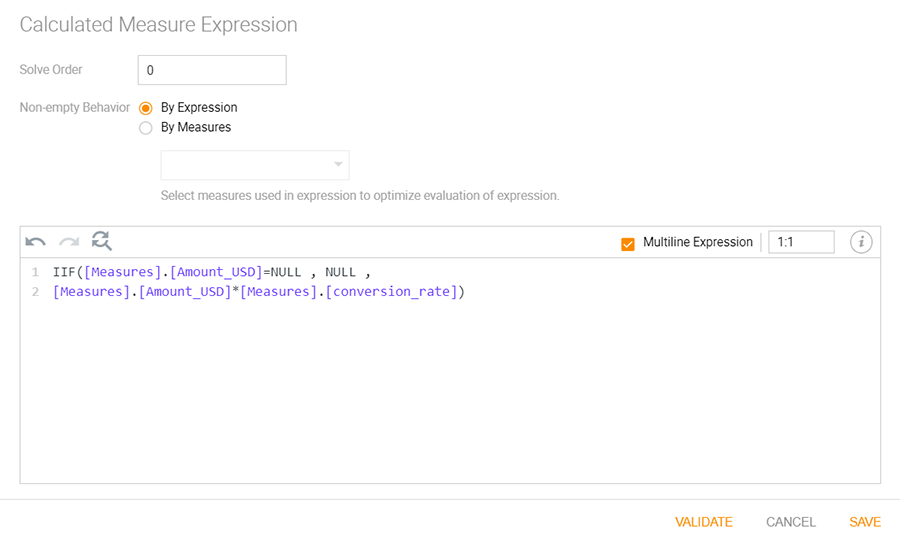
Figure 6: Calculated Measure – Amount in Reporting Currency
Step 4: Visualization
Once the cube is created, the business user can use any BI tool to drag dimensions into their visualizations for analysis. They can then select their filters and switch currencies on their dashboard with instant response times even for trillions of rows of data.
As seen in the image below, we have created a sample visualization with the following dimensions:
- Transaction Id
- Transaction Amount
- Amount in Reporting Currency
Then, filters are applied on Date and Reporting Currency. Now, when the user changes the Reporting Currency filter from EURO to INR or vice-versa, the Transaction Amount immediately gets converted to the selected currency. This conversion happens on-the-fly and delivers instant responses even for trillions of rows of data.
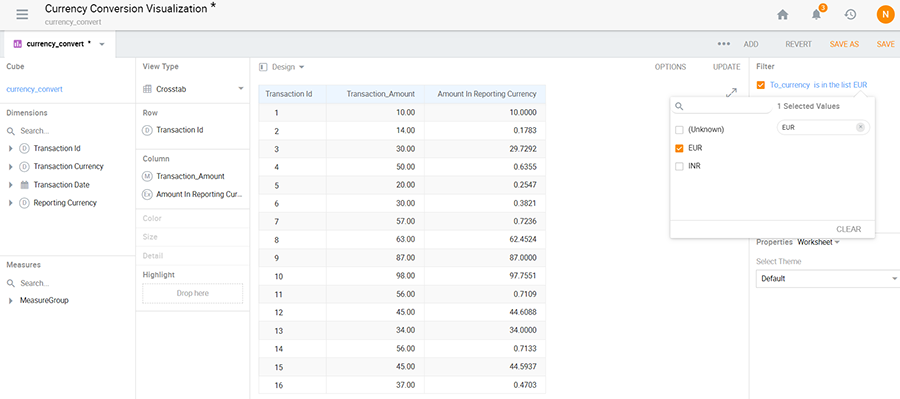
Figure 7: Sample Visualization
The Kyvos Advantage and how it helps
Though the ability to handle multiple currencies is an essential feature of any modern BI solution, achieving it on massive-scale data takes the Kyvos solution to the next level. Some of the unique features of the solution are as follows:
- On-the-fly conversions: Runtime currency conversions eliminate the need to store all combinations. Scheduled automatic incremental cube builds cater to the daily changing conversion rates.
- Unlimited Scalability: Revolutionary technology enables currency conversions on data at a massive scale with high performance. Enables analysis in as many currencies as needed.
- Fast responses: Leverages the compute capacity of the cloud or on-premise data lakes to process data at high speeds. Multiple servers work in parallel to deliver sub-second responses for trillions of transactions.
- Concurrent users: Can handle thousands of concurrent users without slowdowns or any impact on performance.
- Analytical Flexibility: Provides the users with the flexibility to choose the reporting currency on their dashboards and switch views as needed, using any visualization tool of their choice.
If you want to learn more about how we enabled seamless currency conversions for several Fortune companies and how our solution can help you, get in touch now.
