
What this blog covers:
- Understanding what OLAP is and how OLAP systems work.
- Knowing about the types of OLAP, including ROLAP, HOLAP, and MOLAP.
- Introducing Kyvos’ smart and modern OLAP technology built for the cloud.
OLAP was first introduced when the computation power of the system wasn’t as robust and scalable as it is today. The biggest challenge of that time was to extract data from multiple tables, which needed various joins and group by’s to aggregate massive volumes of data. Since computing power was limited, the execution of these heavy queries took minutes and hours (sometimes days too) to bring back the results.
OLAP solved this problem by pre-aggregating all the measures and dimensions at every level to build multidimensional cubes. This Hitchhiker’s guide to OLAP is intended as a starting point for anyone who wants to understand the benefits of online analytical processing (OLAP) and its relevance today.
What is OLAP?
OLAP is an acronym for Online Analytical Processing. It is a computing method that organizes data into multidimensional structures to facilitate users to get information and analyze data from multiple viewpoints. It enables business users to run ad hoc queries, run reports faster, and perform OLAP operations such as slicing, dicing, drill down data to uncover patterns, find relationships between data sets, find anomalies, etc.
Let’s understand OLAP with a simple example — A regional company is trying to break into the US market. They are selling four flavors of fruit drinks – mango, cherry, strawberry, and grapes. And they particularly want to know what’s going on in four specific markets of the US –
- Los Angeles
- Chicago
- New York
- Phoenix
Lots of individuals are buying these fruit drinks in the US. Every purchase is stored in a database of the store from where it was bought. To perform business analysis on this data, they begin by analyzing sales of their products. The below table shows their sales information for the last two quarters of 2020.
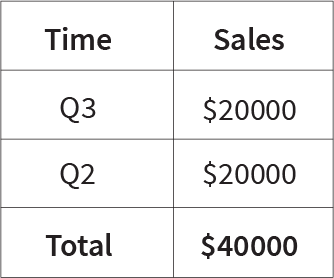
Figure 1 – Sales for last two quarters
Both quarters have the same figures which means that the company has identical sales performance in both quarters. Next, they analyze the same sales data from a few other perspectives like sales of individual flavors and the sales according to the region.
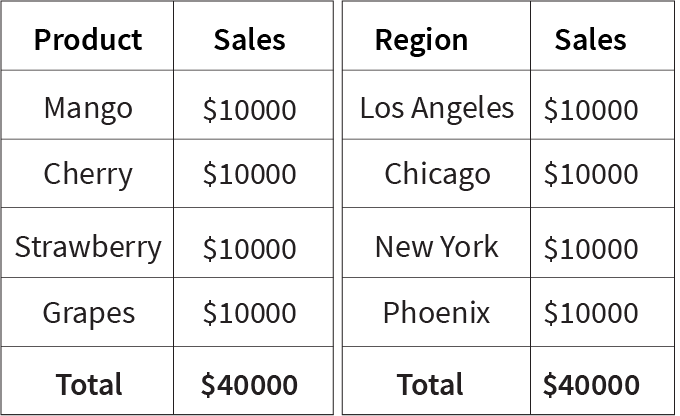
Figure 2 – Sales by flavors and regions
As you can observe, all the three tables show the exact figures – $40000 for all the three views. This means you can be assured that you are looking at the same information – the fruit drink sales of the company with multiple views, each broken into three different categories – time, geography, and product. These categories are called dimensions.
There isn’t much to analyze if we look at data this way. Since the data is the same in all three dimensions. Let’s see what happens if we squeeze the existing three dimensions together to create a single multidimensional view of the data. This is where OLAP comes into the picture.
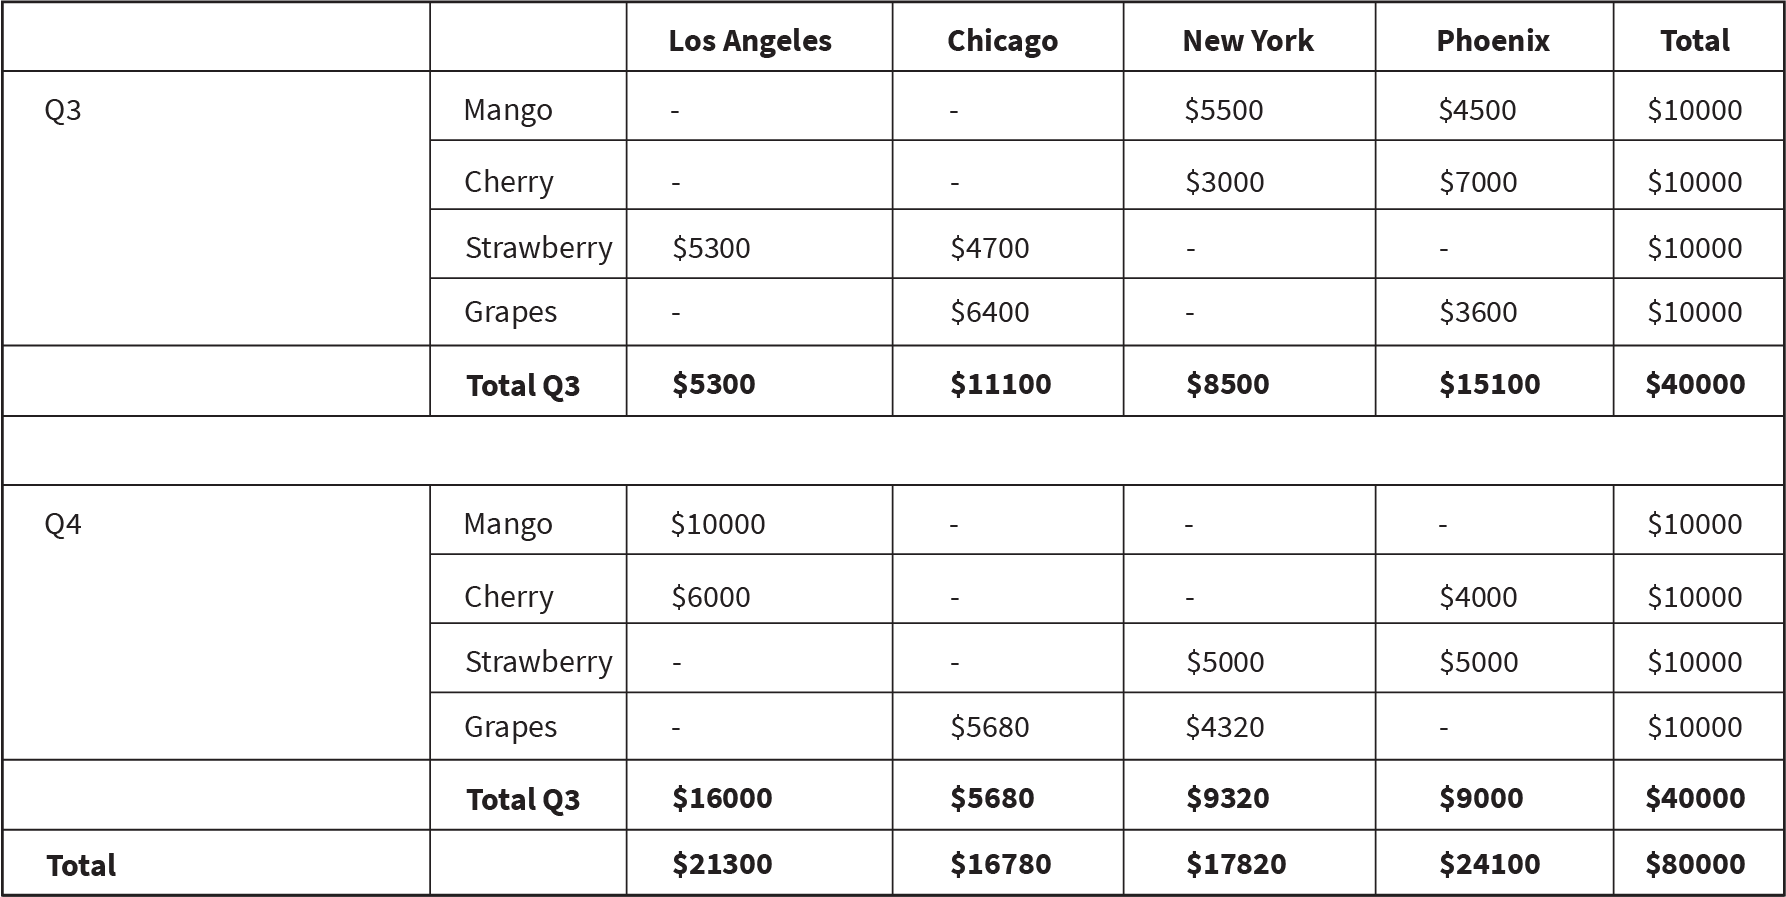
Figure 3 – Sales breakup by flavor and region for each quarter
Now, if you observe this table, you will see the patterns and anomalies that lie in your data. For example –
- Mango and cherry flavor fruit drinks don’t sell in Los Angeles and Chicago in the Q3.
- Strawberry flavor doesn’t sell in New York and Phoenix in the Q3. On the other hand, It’s vice versa in Q4.
- The grape flavor doesn’t sell in Los Angeles in both Q3 & Q4.
These are some patterns, and you can observe more patterns by interacting with your data from multiple viewpoints. This kind of data interaction reveals new and interesting information instead of isolated, single dimension data lists.
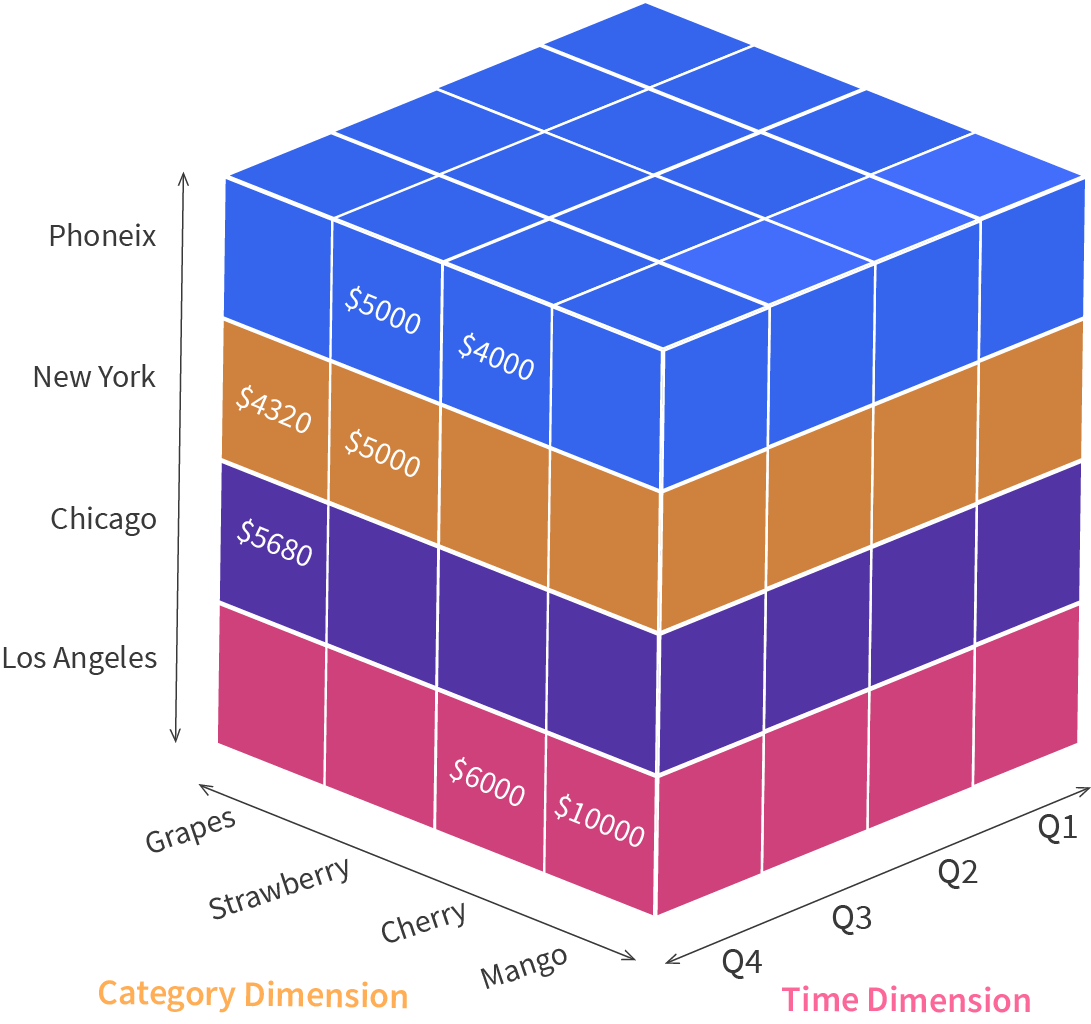
Figure 4 – An OLAP cube representation
The above diagram shows the pre-aggregated and pre-calculated data stored in an OLAP database or OLAP cube. Each cube cell holds a sales value for the intersection of each unique combination of time, geography, and product. Now, users can perform ad-hoc analysis, slice and dice their data by different dimensions, pivot rows, and columns, and drill down through hierarchies to create on-the-fly specialized reports.
Since data is pre-aggregated, the results are retrieved faster, enabling analysts to ask as many questions as they want and gain insights by exploring every interesting pattern and valuable information in a database.
The above example is an over-simplified, hypothetical use case. Real business data is much more complex, and the questions are tough. You have to deal with a large number of dimensions, perform heavy calculations on the fly, as well as deal with large datasets. Imagine the power of OLAP in such a situation!
What is an OLAP Cube?
An OLAP cube is a multidimensional data structure that enables quicker and more efficient processing and analysis. With a data cube, different operations can be performed to explore and manipulate the data, such as slicing, dicing, drilling down, rolling up and pivoting. These operations help answer various business questions in a time-efficient manner. OLAP cubes can enable users to discover patterns from data to make informed decisions, hence making it an important tool for business intelligence and data analysis.
How OLAP Systems Work?
OLAP systems work by retrieving or extracting data from multiple sources, such as relational databases, data warehouses, data marts, or other centralized data stores and clean and organize it into multi-dimensional data cubes.
Types of OLAP – ROLAP, MOLAP, HOLAP
There are three different types of OLAP based on how data is stored in the database.
ROLAP : stands for Relational Online Analytical Processing. It stores data in the form of rows and columns. ROLAP does not pre-compute data; it can be accessed through SQL queries on demand. Thus, ROLAP empowers users to analyze and view data, and is capable of saving storage space while working with massive historical datasets that are not often queried. It can deal with large datasets, but the larger is the dataset more is the processing time. Thus, performance becomes an issue with rising data volumes and concurrencies.
MOLAP: MOLAP is an acronym for Multidimensional Online Analytical Processing. In MOLAP, data is pre-aggregated, summarized, and stored in the form of a multidimensional array. It enables users to model data and visualize it from multiple viewpoints. Since all the complex calculations are done in advance, users can easily perform slice and dice operations on their data with fast response times. However, traditional MOLAP is less scalable than ROLAP, as a limited amount of data can be stored in a multidimensional cube.
HOLAP : Hybrid OLAP is a combination of both MOLAP and ROLAP features. It uses both relational and multidimensional structures to store data, and which one should be used to access data depends on the processing application. Thus, HOLAP provides a mid-way approach to both the methods described above.
Businesses choose the OLAP type based on their business requirements. MOLAP is by far the most used out of the three because it provides high performance. However, the exponential growth of the data has outgrown the capabilities of traditional MOLAP solutions. They fail to handle the explosion of cardinality and dimensions and multiple data sources.
To solve the above challenges and deal with the scale and complexity of modern business data, Kyvos introduced Smart OLAP™ – an innovative technology that eliminates the limitations of traditional OLAP solutions and brings it to the world of big data and modern cloud platforms.
Introducing Smart OLAP™ – Next-gen OLAP designed for the Cloud
Built natively for the cloud, Smart OLAP™ leverages its scalability and elasticity to build multidimensional cubes on extremely large datasets. Advanced algorithms optimize the creation of multidimensional cubes at a massive scale, and these cubes are stored on the cloud itself. As all the combinations are processed in advance, you get instant query responses for all queries even when the concurrency is high. Now, when more data gets added to the BI environment, Smart OLAP™ scales out transparently to build cubes on that data, making it easy to deal with the exponential growth of modern business data. It can scale effortlessly for future data requirements by leveraging the computing capacity of the cloud.
Smart OLAP™ combines the benefits of a scalable data infrastructure with the ease of use of OLAP-based analytics. Another key advantage of Smart OLAP™ is that it uses advanced ML technologies to provide intelligent recommendations that make it easy to optimize cube designs and meet performance SLAs, without the need for technical expertise.
Choose Smart OLAP™ for Scale and Performance on the Cloud
Out of all the different OLAP options out there, today’s businesses need a solution that can break all the barriers of traditional OLAP while relieving you from the worries of future data workloads. Smart OLAP™ is a solution that can help transform your business by combining the flexibility and agility of cloud platforms while sustaining the speed of thought analytics that is needed with massive data on the cloud.
To learn more about how you can leverage OLAP to scale your BI, schedule a demo now.
FAQs
What are the types of OLAP?
There are three different types of OLAP based on how data is stored in the database. 1. ROLAP or Relational Online Analytical Processing stores data in columns and rows, retrieving the information at the user’s demand through queries. 2. In MOLAP or Multidimensional Online Analytical Processing, data is pre-aggregated, summarized, and stored in a multidimensional array that enables users to visualize it from multiple viewpoints 3. Hybrid Online Analytical Processing or HOLAP uses relational and multidimensional structures to store data.
What are the advantages of OLAP?
Instead of just viewing static data, businesses can view current data and perform “what if” analyses with OLAP operations. OLAP system allows users to perform ad hoc analysis. Quick response times and intuitive, multidimensional data help them investigate trends they might miss. Data is arranged in dimensions, representing how business users typically think of the business terms or definitions.
How does OLAP support data analysis?
OLAP enables users to explore and analyze data by providing tools for slicing, dicing, drilling down and pivoting multidimensional data, making it easier to gain insights.
What is the process of building an OLAP cube?
The process involves data modeling, dimension and hierarchy definition, data extraction and transformation, cube design, aggregation and finally, loading the cube with data.
What is the significance of OLAP in business?
OLAP aids decision-making by providing quick access to relevant data for analysis, helping organizations identify trends, make informed decisions and optimize processes.
