
The need to assess how your metrics are changing over time is an essential aspect of business analytics. Evaluating the performance of a metric over the same period in the past makes comparisons more relevant and helps in leveling the effect of sudden spikes, seasonal fluctuations, and more.
Depending upon your analytical needs, you can choose the period of your analysis to be a year, a month, a week, or any other period that works for you. In this blog, we will take the example of year-over-year (YoY) analysis to show how Kyvos simplifies period over period analysis on data at massive scale.
How Kyvos simplifies YoY analysis
YoY calculations can consume a lot of resources and time when done on massive volumes of historical data. Imagine you have millions of daily transactions, and you want to do a YoY analysis to see if you are doing better than the previous year. Further, if you have to slice and dice the reports on another parameter to see the YoY growth for a particular region, product, store, or more, the results need to be computed again.
YoY analysis, when done on massive data, results in poor performance. Kyvos eliminates the limitations of speed and scale and helps you conduct high-speed YoY analysis on massive amounts of data on the cloud or on-premise data lakes.
High Performance on complex YoY calculations on massive historical data
In a SQL-based model, all data required for YoY analysis is aggregated when the query is fired. As a result, complex calculations are done at runtime. Since you need the sum of values for both the current year as well as the previous year, two queries are executed in parallel, and the same data is scanned twice. Subsequently, the result set needs to be joined for further analysis. The cost of the query becomes high, and performance suffers as the size of your data increases.
Kyvos is designed to deliver results quickly even for YoY calculations on data at massive scale. Being a MOLAP-based model, most aggregates are calculated in advance. When comparing the two years, each year is already calculated, the only thing handled at run time is the comparison itself. You get the results instantly without any performance challenges.
Business logic abstraction makes YoY analysis easy for all
In Kyvos, YoY calculation logic is defined in a semantic layer, the Kyvos cube design layer. This is a significant advantage as the entire calculation logic is abstracted from the business user. They can use the calculated measures in their analysis without any coding or the need to write formulas in their BI tools. All business logic is maintained at one place, that is the Kyvos semantic layer, creating a single source of truth.
BI tools can connect to the Kyvos cubes using a standard MDX connection, and users can drag and drop these calculated measures into their visualizations. With Kyvos, you can use a simple tool like Excel to conduct high-speed YoY analysis on data at a massive scale without the need to write any calculation logic in your BI tool.
Kyvos Semantic Layer and YoY analysis
Kyvos computes YoY growth rate by using calculated measures which are defined in the Kyvos semantic layer.
In the example below, two calculated measures are created using the Kyvos Visual Cube Designer:
- Formula to fetch the value of the metric for the previous year (Last Year Profit in this example)
- Formula to calculate the percentage of YOY change (YoY Change %)
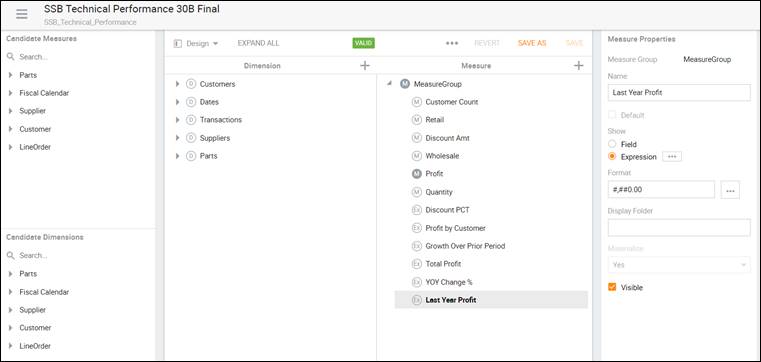
Figure 1: Defining Measures in Kyvos Visual Cube Designer
The formula below gives the parallel period value for the required metric using a time lag interval of 1 year.
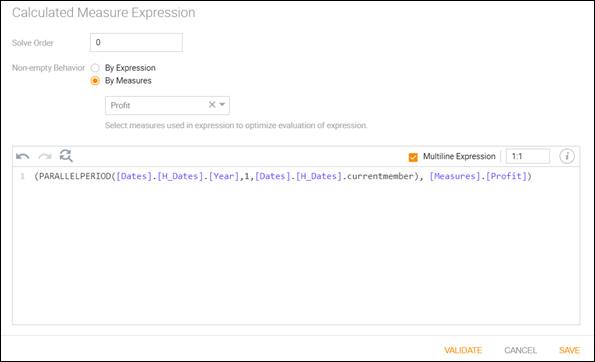
Figure 2: Calculated Measure for computing Last Year Profit
The percentage of YoY Change is calculated using Profit (Profit in the current year) and Last Year Profit (Profit for the previous year).
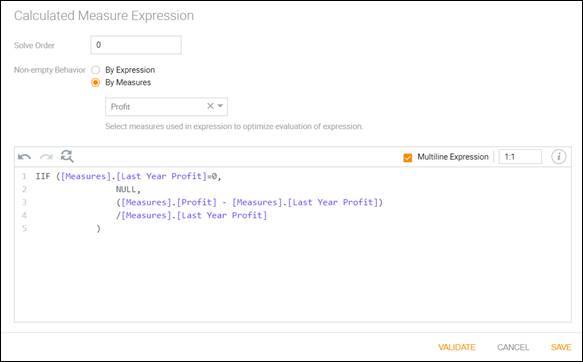
Figure 3: Calculated Measure for computing YoY Change %
Once these calculated measures are defined in the Kyvos semantic layer, you can use any BI tool you like to access these readily available measures. BI tools connect to Kyvos cubes using a standard MDX connection, and you can drag-and-drop these measures into your visualization.
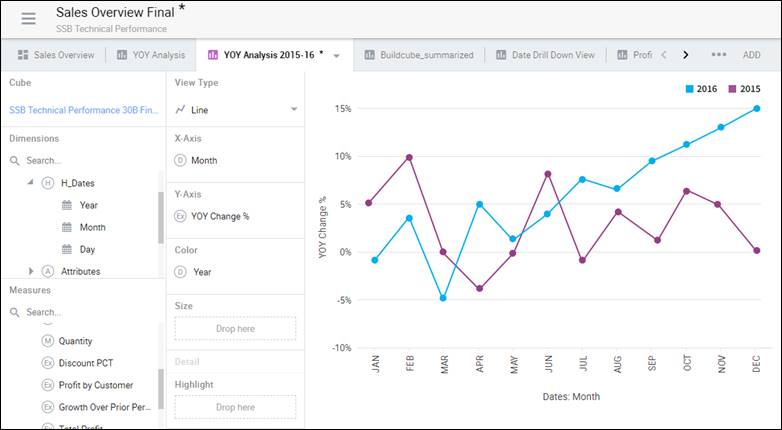
Figure 4: Sample Kyvos Visualization showing YoY Change %
Further, you can add as many dimensions as you need for more in-depth analysis and get instant results. Kyvos enables instant, interactive YoY analysis on any size data. Filtering, drill down, and slice and dice, becomes easy, and you get results within seconds.
If you want to see how you can speed up period over period analysis on massive-scale data on the cloud or on-premise data lakes, request a demo now. Also watch how Adobe scaled business intelligence on Massive Data.
