
In modern business environments, where every transaction is logged, enterprises need efficient ways to model data collected across multiple customer touchpoints, business areas, and data sources so that they can get a holistic view of their business.
However, getting a 360-degree view and drawing business insights by analyzing data aggregated from multiple channels is always a challenge. It becomes essential to label and organize complex data to create simple, consistent views that users across the enterprise can use for their analysis. Data modeling defines the structure in which data is interpreted and used by different entities in the organization.
Often data is stored in different locations, and the volume that needs to be analyzed is exceptionally high. And, that’s what makes data modeling one of the most critical aspects of any BI or analytics project.
The way you model your data will ultimately determine the story that it can tell.
Advanced Business Logic and Data Modeling Challenges
In a complex business scenario such as managing a complete supply chain or doing customer 360 analysis, massive volumes of transactional-level data need to be processed to get a comprehensive view of the business. For example, if you take customer data, it is not just enough to collect transaction-level information from the customers. Enterprises need to know and understand which email prompted the customer to buy, which product from which category in which store is the most-sold one, which promotion strategy worked better, and many more such nuggets of valuable information.
Different pieces of data may be owned by different departments and come from various sources. For example, sales data comes from Salesforce, click data from the website, campaign data from marketing, service request information from call center logs, point-of-sales data from stores, and so on. Let’s take the example of a product that is sold online on a subscription model. If you want to do a customer 360 and get answers to questions such as which campaign or action triggered a purchase or why a subscription got canceled, you need to connect data from multiple touchpoints and sources to understand the customer’s entire journey.
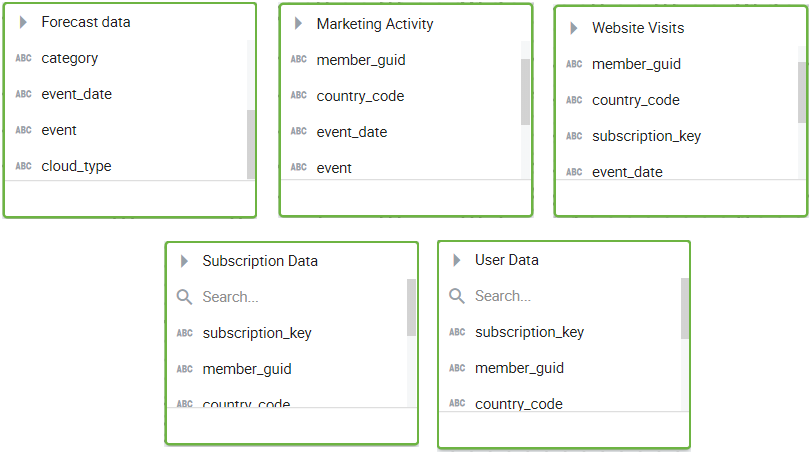
Typically, this customer data lives in more than a dozen fact tables that need to be connected, to understand the customer’s experience through the entire sales cycle. Let’s simplify the use case for understanding here and look at a few fact tables.
- Marketing Activity Fact has details of the events or promotional activities undertaken by the marketing team, such as the event code, name, date, and other information, along with the id of the targeted customer (member_guid).
- Website Visits Fact contains the details of the pages visited by the user, time spent on each page, and more, along with the id of the targeted customer (member_guid). It also has null as member_guid for unknown users.
- Forecast Data Fact stores the quarterly sales projection data for different categories.
- Subscription Data Fact has details on the user’s subscription plan, expiry date, renewals, payment method, etc.
- User Data Fact contains the user’s personal information
In a traditional data warehouse, analyzing data across multiple fact tables is challenging. Complex SQL queries need to be written to get the answer. To get data for a member_guid, you need to scan several tables, which is time-taking. When you do a JOIN on multiple fact tables, it multiplies the number of records due to many-to-many relationships, resulting in data explosion. This, in turn, results in high response time for join queries.
If the data size is large and billions of records need to be examined to get this information, SQL queries are unable to fetch the results in the desired time frame. As a result, ad-hoc analysis becomes tough.
The ability to handle complex data models becomes critical, more so when they are dealing with massive volumes of high-speed data on the cloud or on-premise big data platforms.
How Kyvos Handles Complex Data Models
Kyvos provides a simple way to deploy multi fact physical schemas and deal with complex logical hierarchies. It also takes care of scale, allowing you to analyze any size of data without compromising on performance.
Taking the above example, let’s see how Kyvos helps you analyze data across different fact tables using a
common dimension table. Each customer has a Unique ID called the member_guid. Instead of connecting fact-to-fact directly, Kyvos treats each fact as a single entity and uses dimension tables to connect each fact with their corresponding key. This ensures that records do not multiply during a Join.
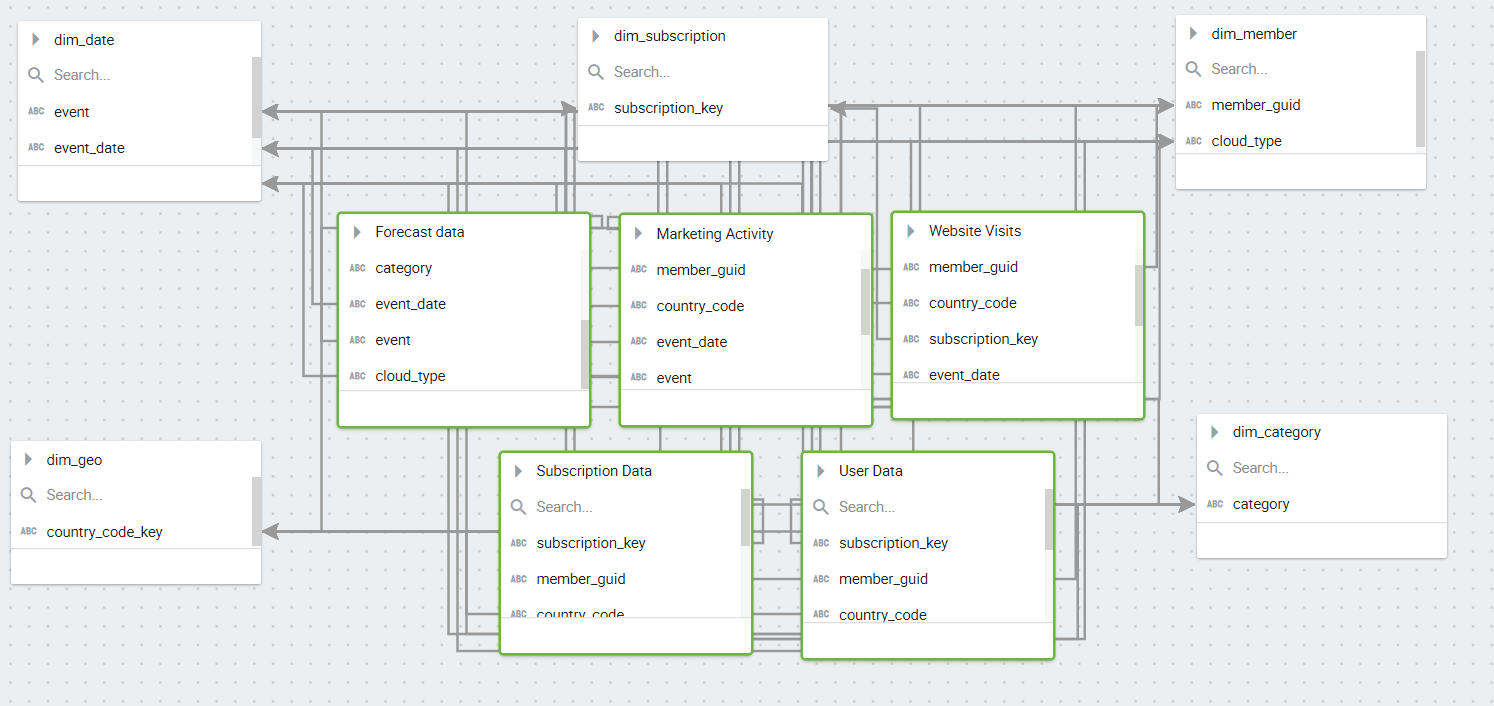
One of the key advantages is that Kyvos builds this semantic model directly on the source data. Dataset relationships that form the basis for the semantic layer are defined first. Next, comes the cube design where the dimensions, the measures, the attributes, and the hierarchies are defined. Once the semantic model is complete, users can query and drill down through a hierarchy in a consistent way.
The Kyvos Advantage
-
Simplified Data modeling
Complex modeling becomes easy as there is no need to write SQL queries for each table. Data from different tables can be joined using a graphical interface. Once the cube is built, users can drag-and-drop dimensions and get the results instantly.
-
Unified Semantic Layer
As Kyvos creates a single unified semantic layer, the same model is available to all business users regardless of the BI tool they use. They can work on Excel, Tableau, MicroStrategy, or any other tool they like, and access the same semantic model. This helps create a consistent view of data for users across the enterprise.
-
Quick Ad-hoc Analysis
The semantic model hides the complexity of the data, and the cube supports the semantic model by delivering instant response times for all queries. Pre-aggregation guarantees to answer complex business questions in seconds. This enables faster processing times on the same complex data model.
-
Scale Without Pain
Moving to the cloud and an on-premise modern data platform become easy as Kyvos supports the same structure as traditional data warehouses but at a much larger scale. There is no need to manipulate data or change your complex models. You can add hierarchies and calculated measures in the semantic layer and define different kinds of hierarchies, such as multiple hierarchies, alternate hierarchy, parent-child hierarchy, different ways of aggregating, custom roll-up, and more.
The ability to model your data such that it is an accurate representation of your business logic is critical for the success of any BI initiative, and its value cannot be underestimated in today’s data environments. Kyvos enables you to turn complex business requirements into data models that deliver get quick, accurate, actionable insights.
To get more information about how Kyvos can simplify complex data modeling for your enterprise, request a demo now.
FAQs
What is data modeling?
When data is stored in multiple locations and has extremely high volumes to analyze for making critical business decisions, data modeling helps define a structure to interpret and prepare this data for analytics. The process creates a visual representation of required information by cleansing the data and defining various dimensions and measures.
What is the purpose of data modelling?
Data modeling helps create a logical and simplified database for better collaborations between teams, unearths opportunities for growth by defining data requirements, and improves data integrity with automated processes with no scope for manual errors. In short, it creates a clearer interpretation of a database for intended usage by determining relationships between data and queries that can run on it.
