
Overview
Compute time and costs are critical measures of a highly performant analytics platform. As the volume and variety of data grow, both measures grow. Increased compute time equates to a slower ability towards discovering strategic patterns. No one wants to wait minutes for query response. People usually abandon a website if it takes more than a couple of seconds to respond. Compute time is a prime component of costs related to analytics platforms.
Much of this increased time and cost in the wake of the growth of data volume and variety is unnecessary. Despite increased query sophistication around data science, most queries across the enterprise are still from everyday analysts (non- data-scientists) of the slice-and-dice totals form. For example, what are the sales of loaves of bread in the U.S. during 2020? Or how many bottles of sparkling water were shipped from Europe to major cities of California and Oregon in 2021?
The values returned by such queries are the sum of potentially millions of rows of data, perhaps billions or even trillions. How many times could those questions be asked over the years by any number of people for various reasons? A few times? Hundreds of times? Thousands? It could potentially be asked daily if it’s part of a chart on a widely utilized dashboard.
As I’ve just described the scenario, an experienced data engineer would have a good, readily available solution for each of the issues. But if we consider more than a few types of events (fact tables) and ways to slice and dice (dimensions), and a larger number of users dependent upon data, a growing infrastructure is required to support scale.
Of course, the title of this blog is a little “clickbaity”. Not all roads will lead to OLAP cubes, but most will. The purpose of this blog is to illustrate in a tongue-in-cheek way the value of Kyvos Smart OLAP™, which could be hard to see when things are still simple.
Following is the story of one such road that leads to OLAP cubes. It’s a tale filled with ups and downs, heroics, and ingenuity.
The Making of a Home-Brewed OLAP
Our story begins with three enterprising department managers. They are frustrated by their opaque vision into the mechanics and performance of their very own respective departments. They’ve been waiting for months for the promised magical data analytics platform that will illuminate an enterprise-wide view.
One day, the three managers independently decide to create their own data marts. The project is considered “shadow IT” and is officially discouraged by IT. However, they promise IT to abide by guidelines, particularly security. IT is happy because they can punt analytics for the departments down the road a bit so they can focus on a backlog of high priority items.
The managers each manage to find a data engineer (between projects or a contractor) and a handful of their own “power analysts” to build the data mart. The narrow scope, lack of dependencies with other departments, and familiarity with the data mean that development is relatively straight-forward. At the department level, no one is constrained by the needs of other departments or data engineers. The analysts know the data inside-out since they work with it every day.
The data marts and a powerful, easy-to-use visualization tool are delivered to its respective managers in short order.
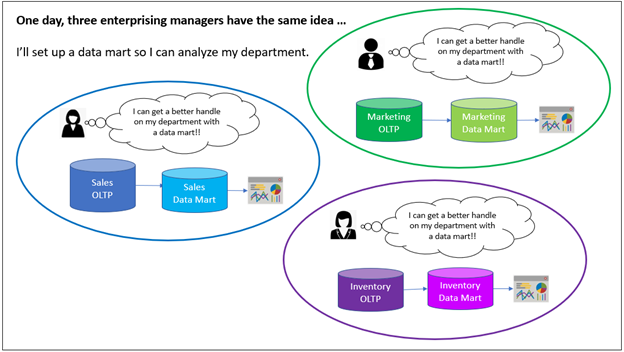
Figure 1 – Three department managers have the same idea.
After just a couple of hours exploring their data marts, the managers have insights about the problems they are facing. They notice abrupt changes in various values and can’t explain it themselves. But they have an idea of who to ask. The source of the problems seems to stem from the activities of adjacent departments, which are mostly black boxes to each other.
In a few days’ timeframe, they contact each other sharing the insights and ask each other questions about the processes within the departments of their counterparts (Figure 2).
However, the sales manager did run into a little query performance problem. The most important queries that broke down sales by regions, months, and/or product categories sometimes took from 30 seconds to several minutes. The sales manager consulted with the data engineer who built her data warehouse.
It turns out there are over thirty billion sales rows over the course of the past decade. She suggested that perhaps they only needed the past five years – the minimum she would need to analyze seasonal patterns. But even that wouldn’t help since the business exploded a few years ago, so 80% of those thirty billion sales rows are within the last five years. That’s still a lot of rows!
The data engineer had a trick up his sleeve, though. He would create a materialized view of the sales table that is aggregated to the store, date, and product levels. That reduced the row count from over thirty billions rows down to just over two billion. Any user query involving those attributes or higher-level categories would use that table, which should return results in about a tenth of the time. On that minority of occasions where other attributes were used, they could still use the raw sales table. The best of both worlds!
The data engineer called this an “aggregation table”. Sure, it took time to create the materialized view and cost a bit to store. But computer time is much cheaper than analyst time, and “storage is cheap”. An elegant solution. All is well.
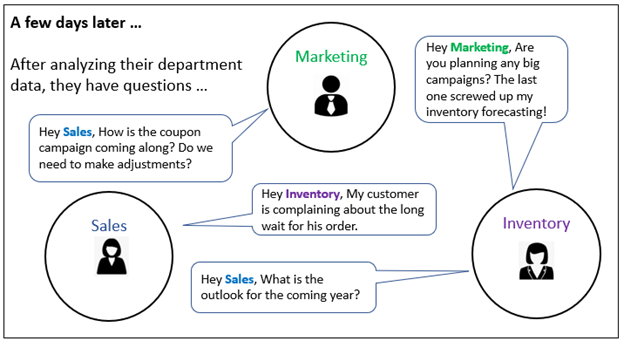
Figure 2 – Managers seeking insights into the processes of other departments.
From their conversations, it’s readily evident that insight into each others’ departments would be beneficial for all of them.
They decide to build a data warehouse incorporating their three data marts. The data engineers who worked on the individual data marts advised them that there will need to be some mapping of entities across the departments and that this will involve a decent-sized infrastructure. But it’s only three departments and all three managers are in complete alignment. They settle on a commercial data warehouse platform. The platform is based on ubiquitous SQL and prides itself on its performance, scalability, and ease of operations.
They extend the contracts of their collective data engineers for six more months, form them into the “data team”, and off they go to build a data warehouse. They are now a lean and mean rogue team.
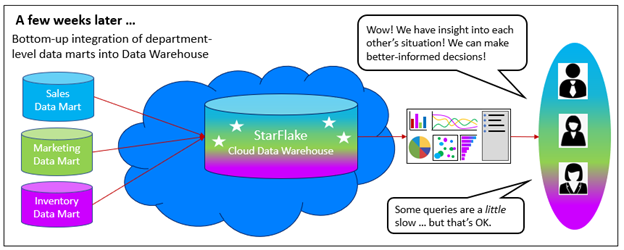
Figure 3 – A cross-department data warehouse is built.
While the gang experienced a rougher time than with their individual data marts, in a few weeks a data warehouse is delivered. The three departments now have insight into each other’s activities and can better plan. Inventory has insight into the plans of marketing and sales.
A couple of query time joins over the large fact tables do seem a little slow, but with only a handful of users, it’s acceptable. The users still say, “Occasionally slow query performance is better than no information at all. I’ll just get a cup of coffee.”
Over the next few weeks (Figure 4), utilization of the data warehouse is fully adopted by the departments. No longer are there just a handful of users. Users across the departments working in multiple roles query the data warehouse from different angles. The department managers and their bosses are still happy, but query performance is degrading.
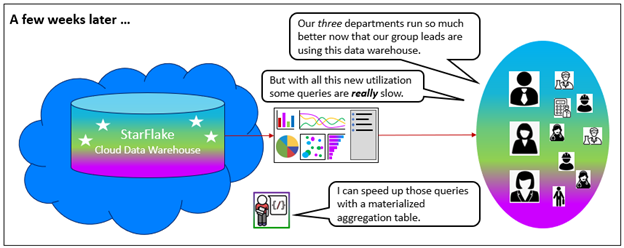
Figure 4 – The data warehouse achieves full traction throughout the three departments.
The added utilization and higher query concurrency have exacerbated the number of slow queries. Slow queries are no longer occasional and there seems to be a general overall slowdown. “Slow information is better than no information” has shifted to “I can only get so many cups of coffee.”
The sales manager recalls the “aggregation table” her data engineer created to solve a performance problem with her individual data mart. But before she could say anything, that data engineer says, “I’m right on it!”
The marketing manager didn’t encounter this query performance problem since the row count of the biggest table in his data mart is under 200 million rows. The inventory manager did experience performance problems involving her largest table, but her data engineer didn’t offer a solution. So inventory just lived the slowness before the data mart integration.
The data engineer, the clever one who built the sales data mart, validates that the performance is mostly due to a high number of queries to the very popular and very large integrated sales-inventory table. To address the problem, he builds another aggregation table, summing sales down to the store, product, salesperson, market campaign, vendor, and day granularity. That cuts the number of rows down a magnitude, from about fifty billion to under a billion rows of summed data. He creates the ETL pipeline to refresh it daily and provides some documentation to the users on the column definitions.
By the end of the day (Figure 5), to the astonishment of everyone, the aggregated table is delivered. The users are trained on when to use this aggregate table over the original raw table. The query times are more than better than before!
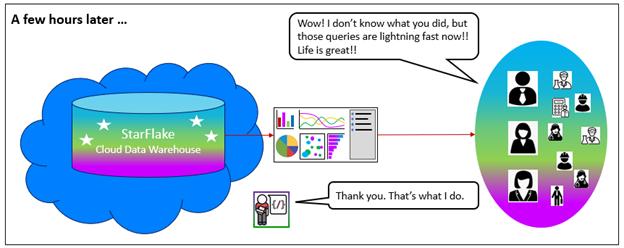
Figure 5 – An aggregation table resolves the occasionally slow query performance.
Since success breeds more success. Over the next few weeks, the data warehouse grows at a steady, predictable pace. However, word of mouth about this fountain spring of information quickly grew. Requests to join the data warehouse come in from the shipping and customer support departments, along with powerful business justification (Figure 6).
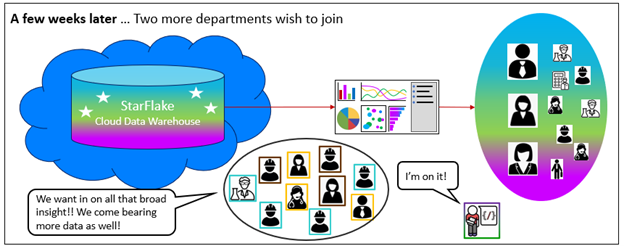
Figure 6 – Two more departments with to be onboarded.
The data engineer team, fresh off their success, begins the onboarding of shipping and customer support, further widening the information view.
A good number of weeks go by (Figure 7) and the new departments are fully moved into production. The team thought this would be easier since the onboarding process was already ironed out with the original three departments. However, they underestimated the difficulty of agreement between the five departments on issues around data mapping, business rules, terminology, and process latency.
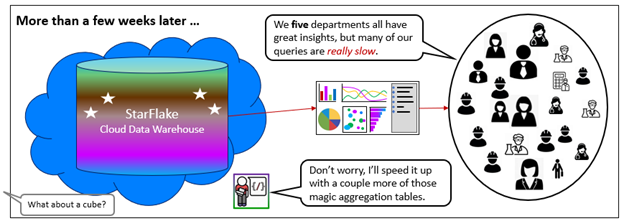
Figure 7 – Five departments onboarded, and the data warehouse is beginning to show signs of strain.
Nonetheless, everyone is happy … except for a few points of poor query performance. Not to worry, the data team knows just how to solve that problem – create aggregation tables. Someone way out in the periphery mentions “cubes”. Some folks chuckle, recalling their struggles with “cubes” a decade or two ago. Why involve another moving part when a few aggregation tables will do the trick?
Although the data team did resolve the query performance with more aggregation tables, it took a few days, not the few hours it took for the first one. Some aggregation tables seemed to overlap. The redundant processing was eating up time and money.
Notice that the data warehouse is taking on a bit of a muddy look. The five departments brought quite a bit of data with them – many tables, objects, and relationships. The users are beginning to find navigation among all those fields a bit cumbersome.
Over the next year (Figure 8) a few more adjacent departments join the data warehouse party – SEO, product development, and legal. The data warehouse is a bonafide success. It’s been credited with vastly improved productivity and insights leading to the creation of profound new products, marketing strategies, and operational optimizations.
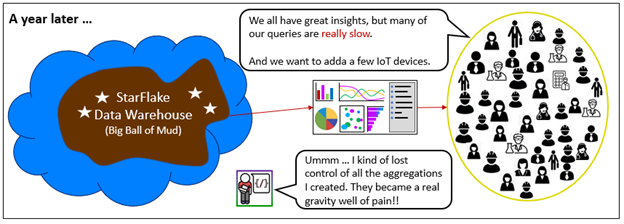
Figure 8 – A year of vast growth.
But it’s been been a tough year for the data engineering team. Onboarding those new departments accrued significant technical debt through shortcuts such as compromises in quality of the integration. Often, much work needed to be redone as disagreements emerged only after viewing previews of the data warehouse in progress. That’s OK because analytics is supposed to be an activity or learning and discovery.
Sales are up about 20%, due to the rollout of high-volume, low-price products. So the sales fact table is growing at a faster rate than anticipated. However, that growth is nothing compared to the surprise plans announced by some departments. The e-commerce department announces that they will track Web traffic at event levels, not the old higher-level page click level. This will give them a finer-grained look at patterns, and it will balloon their Web traffic data by a magnitude or so. Piling on, shipping is adding IoT events from their delivery trucks to constantly fine-tune the routes.
The once sleek data warehouse is now a patchwork of many moving parts. There is a very long list of bugs and requested features. For the moment, that doesn’t bother the users too much because the data warehouse still delivers a great deal of value.
However, the famed query performance is spotty. Slow performance just exacerbates irritation with the now not-so-straight-forward schema. There are now over 50 aggregations serving queries to multiple classes of users with diverse interests. The data engineers estimate that to more than double over the next few months. Each aggregation comes with its own ETL step, eating up compute time.
The line of departments waiting for onboarding doesn’t help. IT offers little help beyond provisoning major-league Cloud infrastructure. They are still happy to let these departments handle this themselves as they focus on implementing new ERP, CRM, and SCM systems.
Those departments awaiting onboarding need to wait. The data team focuses on mitigating the current issues with the current client base, particularly query performance. They split the work into an agile set of two-week sprints. More aggregations to come along with tedious retrofitting to alleviate the technical debt.
After a few weeks, there isn’t enough progress to satisfy the once-happy user base (Figure 9). Although a few bugs have been fixed, no new features have been added and query performance is still unacceptable. Yet, they are better off than they were before the rogue project.
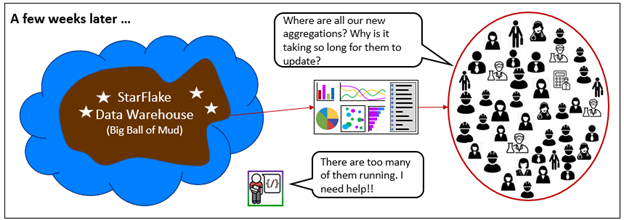
Figure 9 – Improvements are difficult to implement.
The stakeholders set up a meeting with database performance consultants to address the query performance issues that progressively accumulated as the data warehouse grew (Figure 10). The data team fields a litany of questions from the data performance experts.
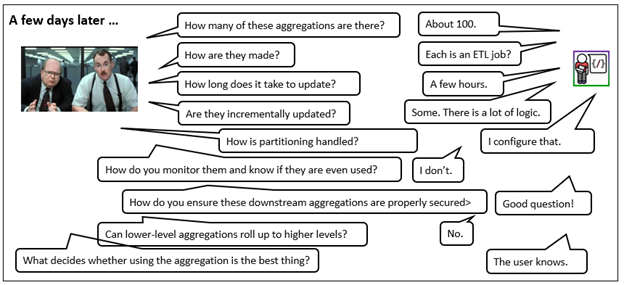
Figure 10 – Trial by database consultants.
By the end of the day-long meeting, the data team internalizes that there is more to aggregation than a few SQL GROUP BY statements. The data warehouse schema is what it is. That is the data we need. However, we could provide a small number of perspectives (dimensional models) targeted for users of various roles. We could generalize the process of managing and optimizing the aggregations.
The data team began to realize that they could build a proper infrastructure for query performance themselves and maintain it as an in-house software product. Or they could seek out a product specializing in this very thing. It’s much easier to learn how to operate a product than to maintain, support, and operate a product.
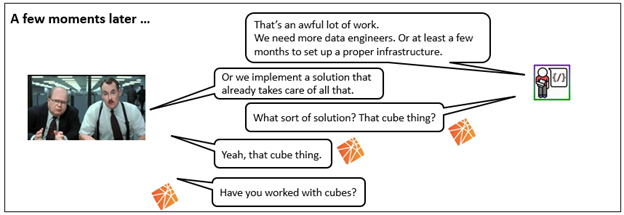
What muddies a “build or buy” dilemma is underestimating the value of what goes into the product we might buy. Since, query performance is a major key to success, it makes sense to offload performance to a best of breed product like Kyvos.
A data warehouse is relatively easy to evolve and maintain when it involves just a few data sources and a few parties of interest. However, just a few more departments turn a linear process into a web of conflicting definitions, rules, and goals. The data engineer team fell into the “everything is easy at small scales” trap.
The Solution
An OLAP cube isn’t simply a set of aggregations. It’s a user-friendly semantic layer presented to users and optimized in the back-end to deliver consistent, maximum performance. The dichotomy of a user-friendly interface and sub-second query response time are two sides of the same coin. Indeed, it’s the structure of the user-friendly dimensional model that facilitates the pre-aggregation. It makes sense when you consider that most business questions are a form of slice and dice mentioned earlier.
Kyvos is such a Cloud-scale OLAP cube platform. Its primary goal is drastically accelerating query performance of analytics databases as well as presenting the data in a user-friendly manner. At a high level this is accomplished through the pre-aggregation of massive volumes of data.
Such a task sounds simple as long as the scope fits within the manual capability of human engineers. Meaning as long as the rate of development and maintenance doesn’t exceed the number of hours in a workday, there isn’t a need for the total cost of ownership of yet another product. However, with all things related to data – the explosion of volume and breadth – nothing will remain at that small scale for long.
As with anything that successfully delivers at large scale there is an elegant underlying mechanism.
OLAP cube technology isn’t as simple as generating aggregation tables. While the implementation of a few aggregations is very straightforward, the full range of functionality isn’t replicated with a few SQL GROUP BY materialized views.
Why? The reason is that there are constraints to all systems. In this case, aggregation of everything is impossible. That’s in terms of the unimaginable number of combinations for aggregation, the time to process all of that, and the storage. What does “all aggregations” mean? It means all combinations of attributes (features, table columns) – the factorial of the number of attributes.
Imagine a rather small and simple data warehouse with 10 customer attributes, 5 date levels, 10 product attributes, 5 salesperson attributes, and 10 location attributes. That’s already about 25,000 possible attribute combinations. A more typical data warehouse would probably sport hundreds of columns. Let’s just say that the number of combinations is a really big number.
Pointing out that there could be a big number of aggregations is not endorsing “combinatorial explosion”. Kyvos doesn’t “promote” the combinatorial explosion of aggregates. It’s about mitigating combinatorial explosion through the smart selection of the most beneficial set that fits within given constraints.
It’s for that reason that Kyvos implemented its state-of-the-art Smart OLAP™ mechanism. It determines the best set of aggregations within the constraints of finite computation, time, storage, and cost. The decisions are based on its automatic, ML-based analysis of the structure of the data model as well as the nature of the queries.
Kyvos Smart OLAP™ employs other mechanisms for mitigating redundant aggregations, data compression, and caching. The details are well beyond the scope of this blog.
Again, this task isn’t difficult when facing one or two aggregation tables. Typically, an enterprise-class OLAP cube generates hundreds of aggregations. Hundreds of aggregations may sound crazy, but that is a very minuscule number of possible aggregations. Considering the multitude of viewpoints from which we can examine data, many really do make sense. Analytics is a learning problem, it’s about discovery.
From the users’ side, the most obvious problem resolved through Kyvos is how to select the best aggregation table for her particular query. The raw tables with billions of rows or one of the many aggregation tables? A wide number of attributes makes such a selection not very obvious for someone who isn’t a data engineer. Through a Kyvos cube, there is no need to when one of the aggregation tables would be better, or that the raw table is used for situations without a pre-aggregated table. It just works.
Each of these potentially hundreds of aggregations require indexes, updates, deletion (if it’s no longer needed), partitioning, caching. For the data engineer team, each aggregation represents an ETL step.
For a Kyvos cube, the processing and optimization of each aggregation amounts to just one ETL step – processing of the OLAP cube. But that one simple step encapsulates much sophisticated logic. Dimension tables must be processed. A root aggregation table must be created. All aggregations are built on from it. There should be an order that maximizes the available resources in order to minimize the start-to-end process time.
Let’s not forget mechanisms for connecting to a variety of sources and designing a user-friendly dimensional model. Business rule calculations could be centralized through calculated measures authored with elegant, highly-expressive language. Cube Data can be secured in a very versatile manner from a high level down to an individual cell.
Lastly, as a reminder, pre-aggregation doesn’t just accelerate the performance of queries computed from massive numbers of rows (billions to trillions). There is also the other scaling “dimension” of high concurrency (larger number of concurrent cube users). Analytics is no longer a matter of a few users computing over a trillion rows. The expanded concurrent utilization of analytics data by a wider breadth of information workers issuing queries involving a “mere” hundred million rows can be served equally well through a Kyvos cube.
Conclusion
Pre-aggregation of sums is a fundamental method for conserving precious resources by mitigating unnecessarily redundant computation. A big hint as to its fundamental status is that it has been rediscovered by thousands of data engineers. Kyvos Smart OLAP™ encapsulates that fundamental methodology for delivering data in a highly accelerated and user-friendly fashion. It is developed and continuously enhanced by experts in this field. Adoption of Kyvos Smart OLAP™ eases a significant burden on data engineers.
While it is true that the world is in constant change, the change is at different rates. Most things in business actually don’t change very quickly. We usually have lots of time to prepare for paradigm shifts. If we embrace the upcoming change when we first see it, rather than fighting or ignoring it, we have enough time.
OLAP cubes are perceived as rigid, but that’s only true from the perspective of schema. From another perspective, given the imperative for robust and accelerated query performance, Kyvos Smart OLAP™ proves to be very versatile. It is a thousand performance patches transformed into an elegant solution.
FAQ
How do OLAP cubes work?
OLAP cubes work through the pre-aggregation of massive volumes of data. It determines the best set of aggregations within the constraints of finite computation, time, storage, and cost. The decisions are based on its automatic, ML-based analysis of the structure of the data model and the nature of the queries.
What are the types of OLAP cubes?
There are three different types of OLAP based on how data is stored in the database.
ROLAP stands for Relational Online Analytical Processing. It stores data in the form of rows and columns.
MOLAP is an acronym for Multidimensional Online Analytical Processing. Here, data is pre-aggregated, summarized, and stored in the form of a multidimensional array.
HOLAP or Hybrid OLAP is a combination of both MOLAP and ROLAP features. It uses both relational and multidimensional structures to store data.
Are OLAP cubes still used?
The first OLAP product was launched in 1975, and through the 1990s, OLAP grew in its popularity. The rise of Hadoop in the early 2000s led to apprehensions that “OLAP was Dead,” but it got reinvented by companies like Kyvos that modernized OLAP to deal with the scale and complexity of the modern data ecosystem.
What is OLAP used for?
OLAP is used for the execution of these heavy queries within seconds by pre-aggregating all the measures and dimensions at every level to build multidimensional cubes. Kyvos Smart OLAP™ uses advanced ML technologies to provide intelligent recommendations that make it easy to optimize cube designs and meet performance SLAs without the need for technical expertise.
