
Designing an optimized, high-performant OLAP cube on complex data is not an art anymore. Kyvos helps you understand your data and query patterns before the cube is built and create designs that deliver the performance that you need. In this post, we will discuss how Kyvos enables smarter analytics on massive data on the cloud and on-premise data lakes through its data profiling and query analysis features.
OLAP on today’s data: The need for smartness
In the OLAP world, query performance depends on how the data is pre-aggregated. Therefore, cube designs are extremely important to achieve the desired performance. Let us take the example of a complex data scenario with millions of cardinalities, hundreds of dimensions, and massive volumes of raw data. Building aggregates on such data is not easy. One option is to build a cube with all possible combinations where all the dimensions are evaluated against each other for all combinations. In this case, though you may get performance, the cube size will increase.
It is important to maintain a balance between the query response times and the cube size or its build time. The more complex your data, the more difficult it becomes to achieve this balance. The question now is – how to design an optimized cube that can deliver the expected query performance while maintaining the cube size.
Data experts and analysts recommend building cubes for combinations that are queried more often or are more relevant to the business users who would be using the cube for analysis. Also, you should understand your data before you build cubes on it. For example, it makes sense to build the cube on data that has high cardinality and for which generating response at the querying time is non-performant. You need some intelligence that can help you build smarter aggregates.
The Kyvos Smart Recommendation Engine brings in that smartness, helping you understand your data and query patterns to build an optimized cube that can meet your business user’s needs.
Let us now take a look at some of the features that power this smartness.
Intelligent Query Analyser
The Kyvos query analyzer helps you design a cube based on users’ query patterns. It examines how users are using the cube, which filters they are using, what are the key dimensions and measures, and so on. This information helps in building the cube such that it meets your business needs.
Query analysis is generally done on smaller datasets. For example, if you want to analyze one-year data, you can start by building a cube with a day’s or a week’s data and expose it to the business users. Once they start querying this cube, their responses are collected and analyzed. The query analyzer uses complex algorithms to understand query patterns.
Kyvos offers two types of query analysis:
- Live query analysis
- Cumulative query analysis
Based on parameters such as query response times, the cardinality of dimensions, user count, etc., the query analyzer helps in determining the best cube design that can deliver the desired performance.
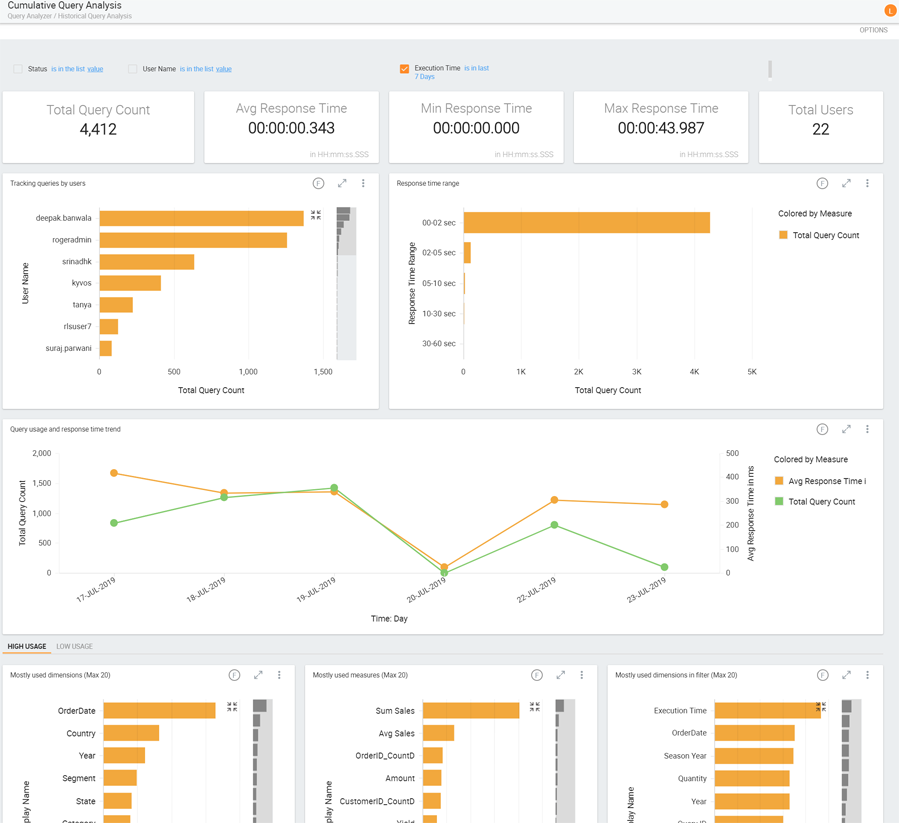
Figure 1: Smarter analytics with query analysis
Advanced Data Profiling
The data profiling feature helps in understanding data before building the cube on it. It provides information on the cardinality of dimensions, the minimum-maximum range, the number of unknowns, value distribution, invalid values, and many other useful parameters. These insights can then be used to design an optimized cube.
Introducing Kyvos – the next-generation OLAP solution for massive data
Kyvos enables easy migration of your SSAS cubes to modern data platforms. It has been built with SSAS compatibility in mind and works on both on-premise as well as cloud platforms.
Suppose you have to design a cube with three levels in a single hierarchy. You have a dimension called geography, which has three levels – country, state, and city. Based on their cardinalities, you can decide the level for which aggregations should be done in a hierarchy. Suppose the cardinality of city is large, say fifty thousand while that for state is less, say five thousand. In this case, you can keep aggregates on city in the cube, whereas aggregates for state can be calculated during runtime. Data profiling can also be used to break a dimension into multiple dimensions. Let’s take the case where a product has several attributes. When all the attributes are combined, the cardinality becomes very large, say a hundred-million. In this case, you can group attributes into multiple dimensions. The data profiling feature helps in getting such information easily without writing queries to fetch this data.
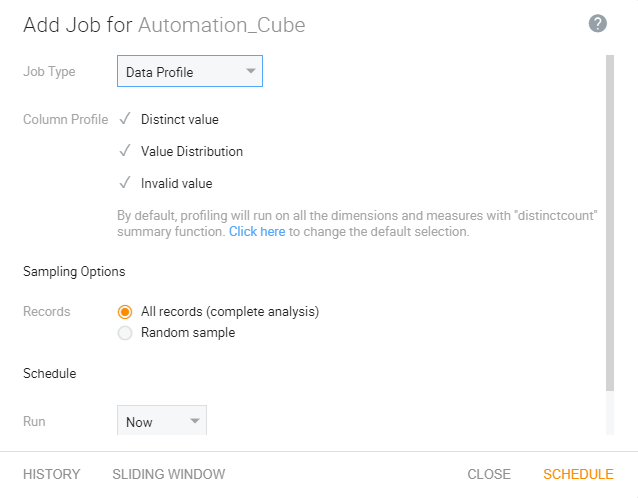
Figure 2: Smarter analytics with data profiling
The Kyvos data profiling feature can be run on both the cube as well as your raw data. Based on the results, you can decide to ignore the fields that have all null values, order them based on their cardinalities, sort them in ascending or descending order, and so on. The information helps in designing the cube, taking into account the parameters that affect its performance. You can also use the manual profiling option to profile data on a single dimension.
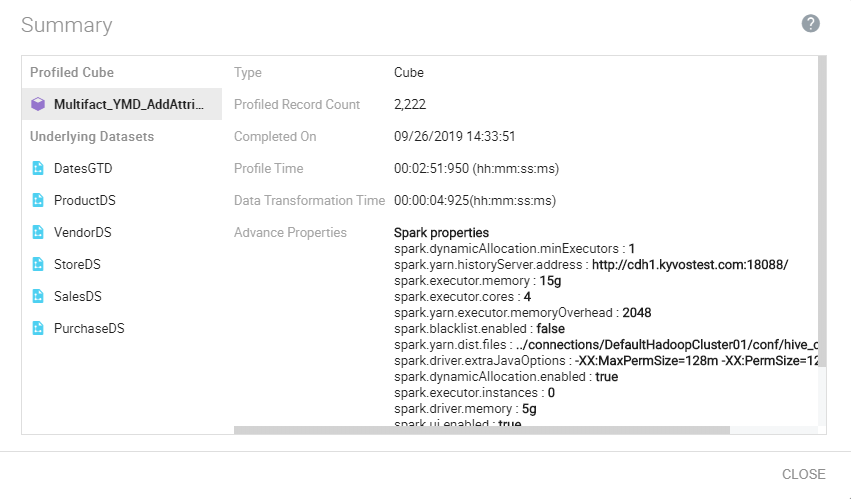
Figure 3: Smarter analytics data profiling summary results
Smart Recommendation Engine
The Kyvos smart recommendation engine is an easy-to-use automated engine that helps you optimize cube designs to achieve the performance that your business needs. It uses the power of features such as the Query Analyzer, Data Profiling Engine, and other advanced features to help you build a high-performant cube. Using sophisticated algorithms, it provides suggestions on cube properties, cube designs, and other parameters that help in tuning the cube to deliver the best possible performance.
The Kyvos Smart Recommendation Engine helps the user decide memory configurations, partitioning strategy, materialization strategy, physical view of the cube in terms of which attributes should be together and which should be in the other dimension, which dimensions can be combined, and so on.
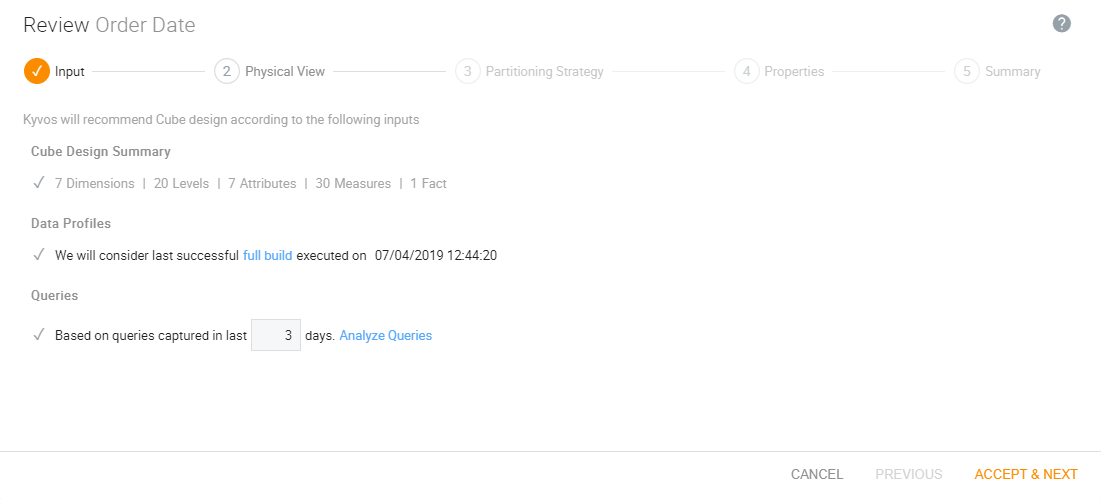
Figure 4: Smart cube recommendation engine input screen
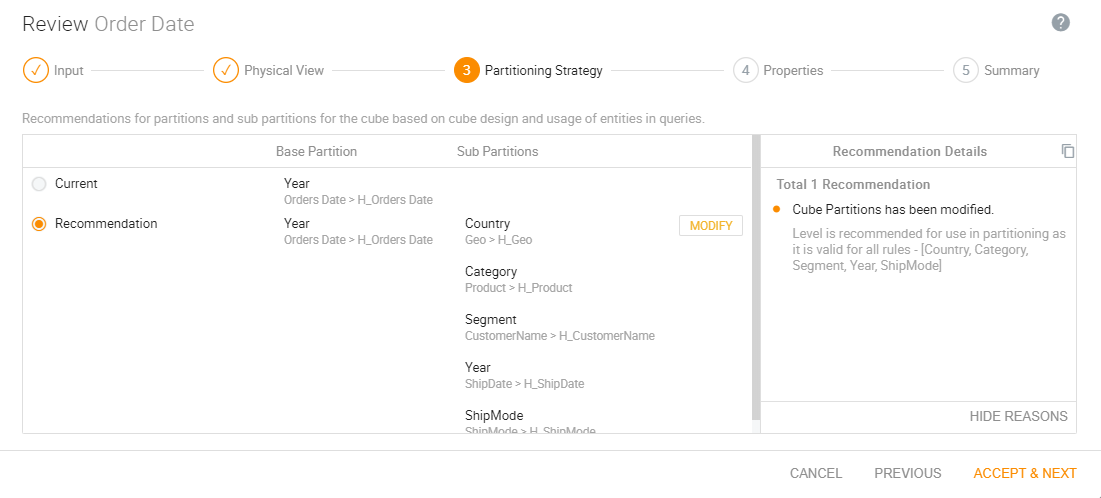
Figure 5: Smart cube recommendation engine partitioning strategy
The cube designing process becomes very simple as the system provides intelligent recommendations, and all that the user has to do is to accept those recommendations. The users can optimize the cube himself, without the need for technical expertise.
Smarter Analytics with Kyvos
The process that Kyvos uses to help you build smarter cubes can be summarized as follows:
Smart test build where the user builds the cube on a sample dataset. He can choose parameters for the test build, such as the size of the data, the number of partitions, and so on.
- Quickly get a browsable cube ready on a smaller dataset.
- Expose the cube to business users and run queries on the sample cube.
- The Smart Recommendation Engine intelligently analyzes query patterns, cube performance, and the data profile.
- Based on the analysis, it recommends the tuning parameters.
- The user accepts the suggestions provided by the Smart Recommendation Engine.
- The optimized cube design is used to build the actual cube.
If you want to learn more about how Kyvos enables smarter analytics on massive data, request a demo now.
