
The data now available in modern platforms is an opportunity for companies from the Fortune 50 through the mid-market to find insights at a completely new level. Firms can now store years of fine-grained history, down to an individual and transactional level. The potential for doing more detailed work – like Cohort Analysis – was bright.
While storing/ingesting data at this depth and breadth is relatively straightforward, actually consuming it quickly and cost-effectively is another matter. The market initially believed it could solve for BI Consumption/Acceleration with brute force processing alone. The result has been BI/Analytic teams living with slow front-ends and IT teams trying to manage surprise consumption bills.
In this blog, you will see how Kyvos is enabling analysts across Marketing, Research, Finance – really any vertical dealing with massive data – to do Cohort Analysis on a completely new scale.
Challenges of Cohort Analysis in the Age of Cloud and Big Data
Cohort projects stand to benefit when analysts can dive into transaction-level data across years of history, but this same scale presents a number of challenges to traditional BI tools as well as native cloud apps. Data volumes going to 100s of billions of rows; Terabytes, if not Petabytes of data; and complex data schema and calculations mean the business users end up relying on IT to help broker any and every question asked.
Iterating on query results is a key component of Cohort Analysis, and the business simply cannot afford to wait hours (or days or weeks) to go through an IT/Engineering cycle before asking the next question.
In the age of the cloud and big data, business users and analysts need a way that makes Cohort Analysis manageable by:
- Enabling self-serve, interactive analysis
- Preserving the most granular detail
- Working with the full depth and breadth of your data
How Kyvos Simplifies Cohort Analysis
Kyvos delivers on these requirements and using an intuitive interface to make self-serve Cohort Analysis possible at a true, enterprise scale. Additionally, the platform’s native capabilities to deal with massive data volumes and real-life complex data models enables “no-compromise” analysis.
Instead of writing long, time-consuming SQL queries, you can specify your cohort condition with just a few clicks. This makes it easy for business users to run cohort analysis, without the need for coding knowledge or dependency on other teams. The high performance of the platform ensures that reports are refreshed quickly and business users get results instantly. Depending upon the results, they can adjust their criteria as they zero in on the result, making it easy to iterate without IT resources.
Kyvos Cohort Builder – A Retail Example
The example below works with a fictional Retail store that sells baby products. Their dataset has information about the customer, order, and the products sold, with each product belonging to a particular “Category”. The screen here shows the Total Customer Count of people who bought products from the retailer.
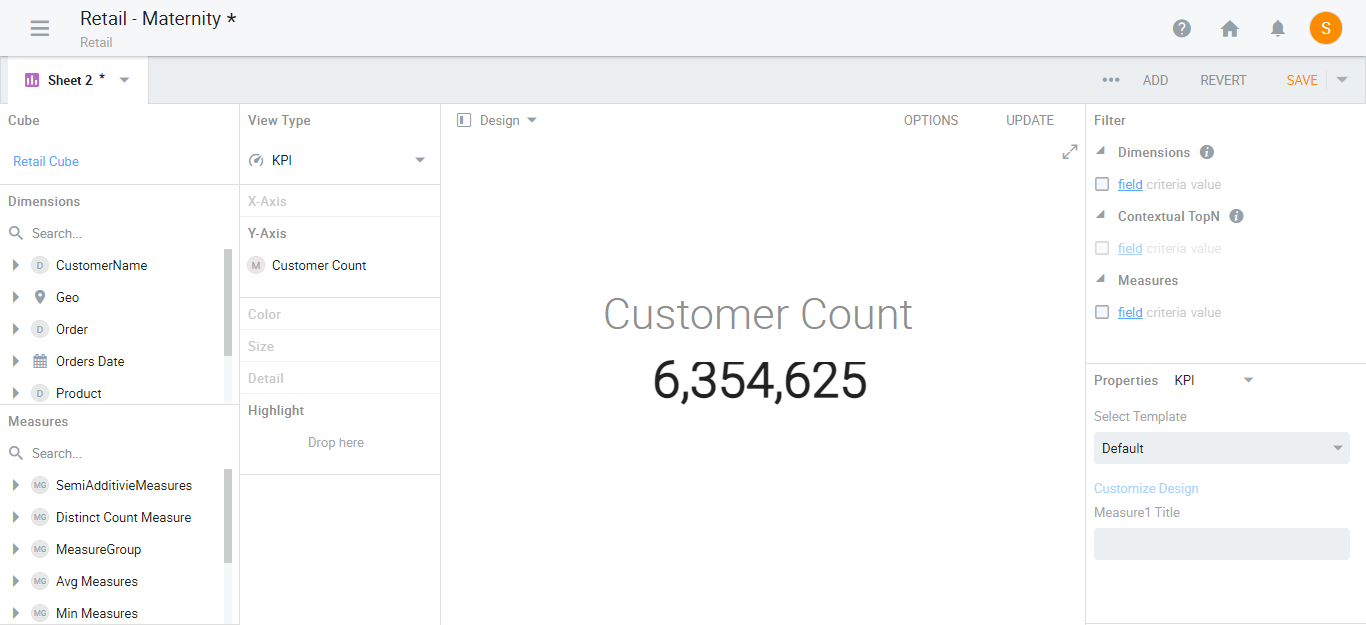
Figure 1: Example use case of a retailer that sells mother and baby products, and has more than 6 million customers.
The business wants to include “the number of women who bought maternity products in the last quarter but have not bought baby products as yet” as part of a targeted Marketing campaign to drive sales in their baby category.
To specify this cohort, they simply need to specify a List by Condition for filter:
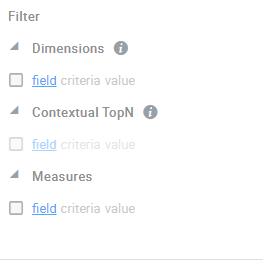
Figure 2: Filter section in Kyvos.
To begin, users need to apply a filter on the Customer ID.
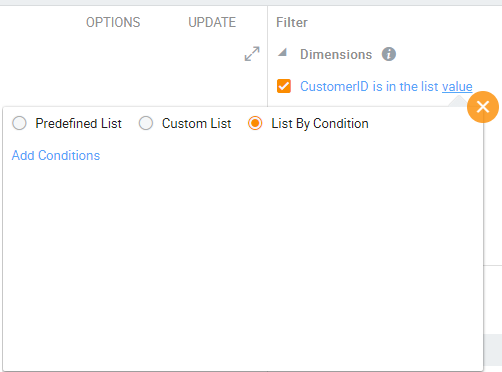
Figure 3: Filter section in Kyvos showing the cohort condition
Then, they add a filter where Category is Maternity Products and Quarter is Q4-2020 by clicking on add condition link in the above interface.
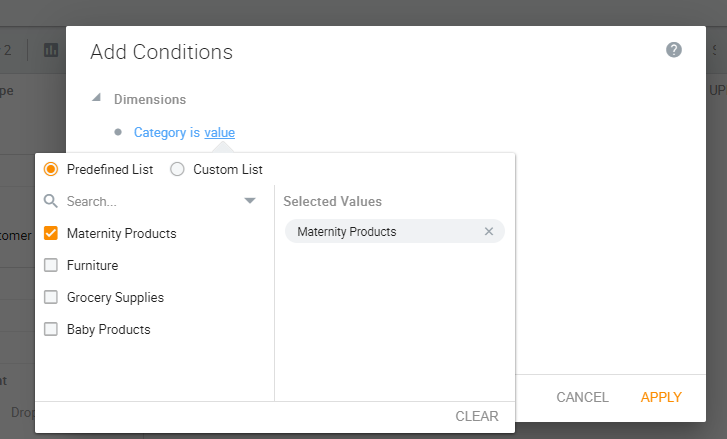
Figure 4: “Add Conditions” window – Specify cohort conditions without any programming or scripting.
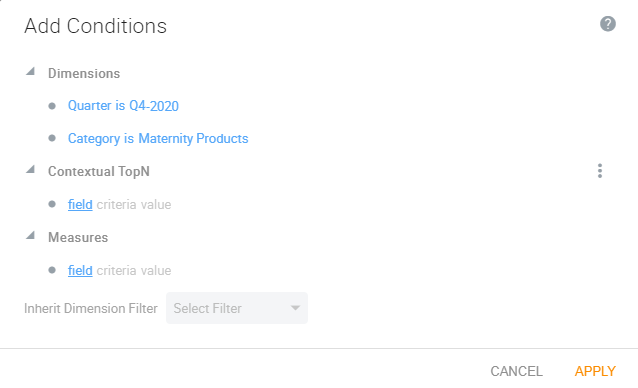
Figure 5: Defining conditions to filter customers who bought Maternity products in Q4 2020.
Next, the user can specify the cohort condition and apply the filter. In this case, the condition is “Customers who bought Maternity products in Q4 2020, but have not bought Baby products in Q1 2021”.
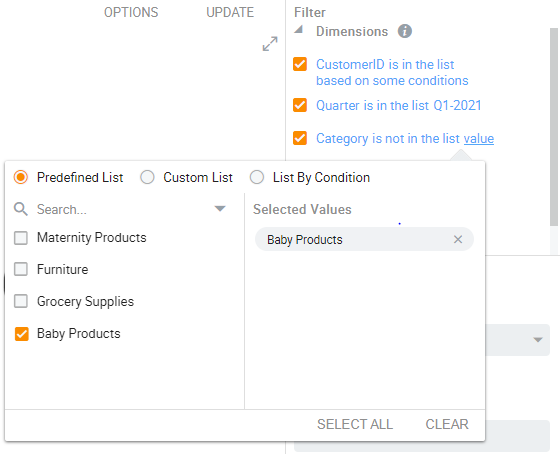
Figure 6: Adding the cohort condition to find those who have not bought Baby products in Q1 2021.
Once the filter is applied, the dashboard refreshes instantly (even for extremely large datasets and multiple conditions). Users can review the results to find out if they make business sense. If not, they can update the cohort condition and quickly iterate until they find the desired result.
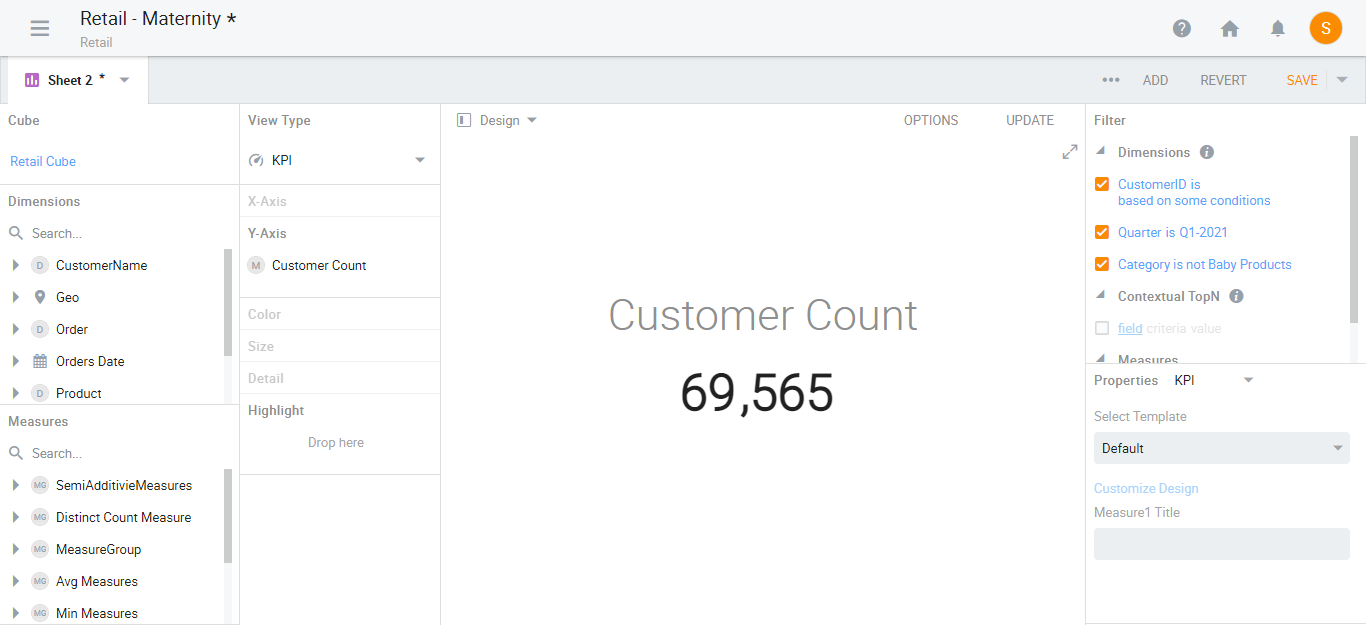
Figure 7: Dashboard updates instantly, even for large datasets and complex cohort conditions.
Key Benefits of Cohort Analysis with Kyvos
-
You don’t need to be a Data Analyst or BI specialist to perform Cohort Analysis in Kyvos.
The Kyvos UI makes it so easy to define cohorts and get results that almost anyone can perform analysis without the need for technical expertise or support.
-
You don’t have to wait for days and weeks to perform cohort analysis if you are using Kyvos.
Superfast query responses and near-instant dashboard updates deliver the interactivity the business needs, making it easy to experiment, explore, adjust, and “follow the data” with essentially no downtime.
-
You can perform Cohort Analysis on all your data, irrespective of its size or complexity.
Kyvos’ ability to deal with massive datasets without compromising on performance makes it easy to perform Cohort Analysis on complex data models that may contain years of historical data.
If you want to learn more about our cohort analysis feature or need answers to further questions, request a 1-on-1 demo now.
