
Ever imagined, how much information is captured by our sense organs every day and how our brain uses it to make decisions and take actions? According to research, 75% of information reaches our brain visually, 13% comes through hearing, and 12% comes through smell, taste, and touch. Our brain uses this information and gives us the command that helps us thrive in our environment. Similarly, Business Intelligence (BI) tools act as the brain of your company.
BI tools for big data visualization, help companies make intelligent decisions by interpreting present and historical data into easy-to-understand visualizations within the business context. Popular tools such as Tableau, MicroStrategy, and Power BI aim to simplify analysis for business users. Their drag-and-drop features let business users interact with the data without writing complex SQL queries or code.
What Are the Key Limitations of BI Tools?
No matter how well-planned their data strategy is, enterprises still have to go through some BI challenges due to exploding data volumes. The hot mess of data growing by the day makes it challenging to perform analytics on the cloud. BI tools fail to meet the requirements of more profound and faster insights into enterprise data. When business users use BI tools to fire complex queries on massive datasets on the cloud, it sometimes takes hours or minutes to bring a response. As a result, dashboards and visualizations become sluggish.
Modern enterprises need a solution that can help them perform accelerated analytics on massive amounts of data while providing a unified view of their business. Kyvos helps BI tools thrive in this new world of modern data analytics. Using its patented Smart OLAP™ technology, Kyvos builds a BI acceleration layer on modern data platforms that enable users across your organization to perform self-service, interactive analysis on billions and trillions of rows of data using any BI tool of choice.
Live Connection with your Existing BI tools
Kyvos creates a live connection between your existing BI tool and your data platform, both on the cloud as well as an on-premise data platform. You can use custom Kyvos connectors or industry-standard connectors and APIs such as SQL and MDX on your existing BI tool.
Accelerate BI Tool Performance with a Smart Semantic Layer™ on the Cloud
Kyvos builds a high-performing semantic layer on the cloud that bridges the gap between complex data sources and business users. Once the live connection is made, BI tools can connect to this layer instead of connecting directly to the data platform. The semantic layer offers benefits such as:
- The semantic layer provides a unified view of data to business users by hiding the physical complexity of data and defining business metrics, data access, and transformations all in one place. This enables business users to visualize massive data with super-fast response times. Hence, improving querying speed and performance.
- One of the significant challenges encountered by enterprises with massive data is inflicting a single standard for consuming and performing analytics. Due to this, enterprises opt for more than one BI tool for different business units or groups, causing chaos as every business unit has its own version of truth now, resulting in siloed reporting. By adding a semantic layer to the cloud, enterprises can eliminate siloed reporting and achieve a single source of truth while supercharging BI tool performance. No matter how many BI tools an enterprise uses, it can empower all business users to speak the same language by introducing a semantic layer in its architecture.
How Does Kyvos Smart Semantic Layer™ Work
The way Kyvos works is that it builds the semantic layer directly on the source data; so, it can leverage the scale and flexibility of the underlying data platform. As a result, there is no data movement. All the measures, attributes, hierarchies, and dimensions are defined in the Kyvos cube. The semantic model becomes easy to understand for the business users and they can access these cubes within their BI tools without any unnecessary latencies.
Let us now see how Kyvos ensures that the same semantic model is available to all users irrespective of the tool they use and how it delivers exceptionally high performance on all tools.
Here, we have taken the standard Star Schema Benchmark (SSB) Schema with 30B rows of data. This schema has the following tables: lineorder, customer, supplier, part, and dwdate. The dataset contains two years of sales data for different regions and segments. Now we’ll define the semantic model through the cube in Kyvos.
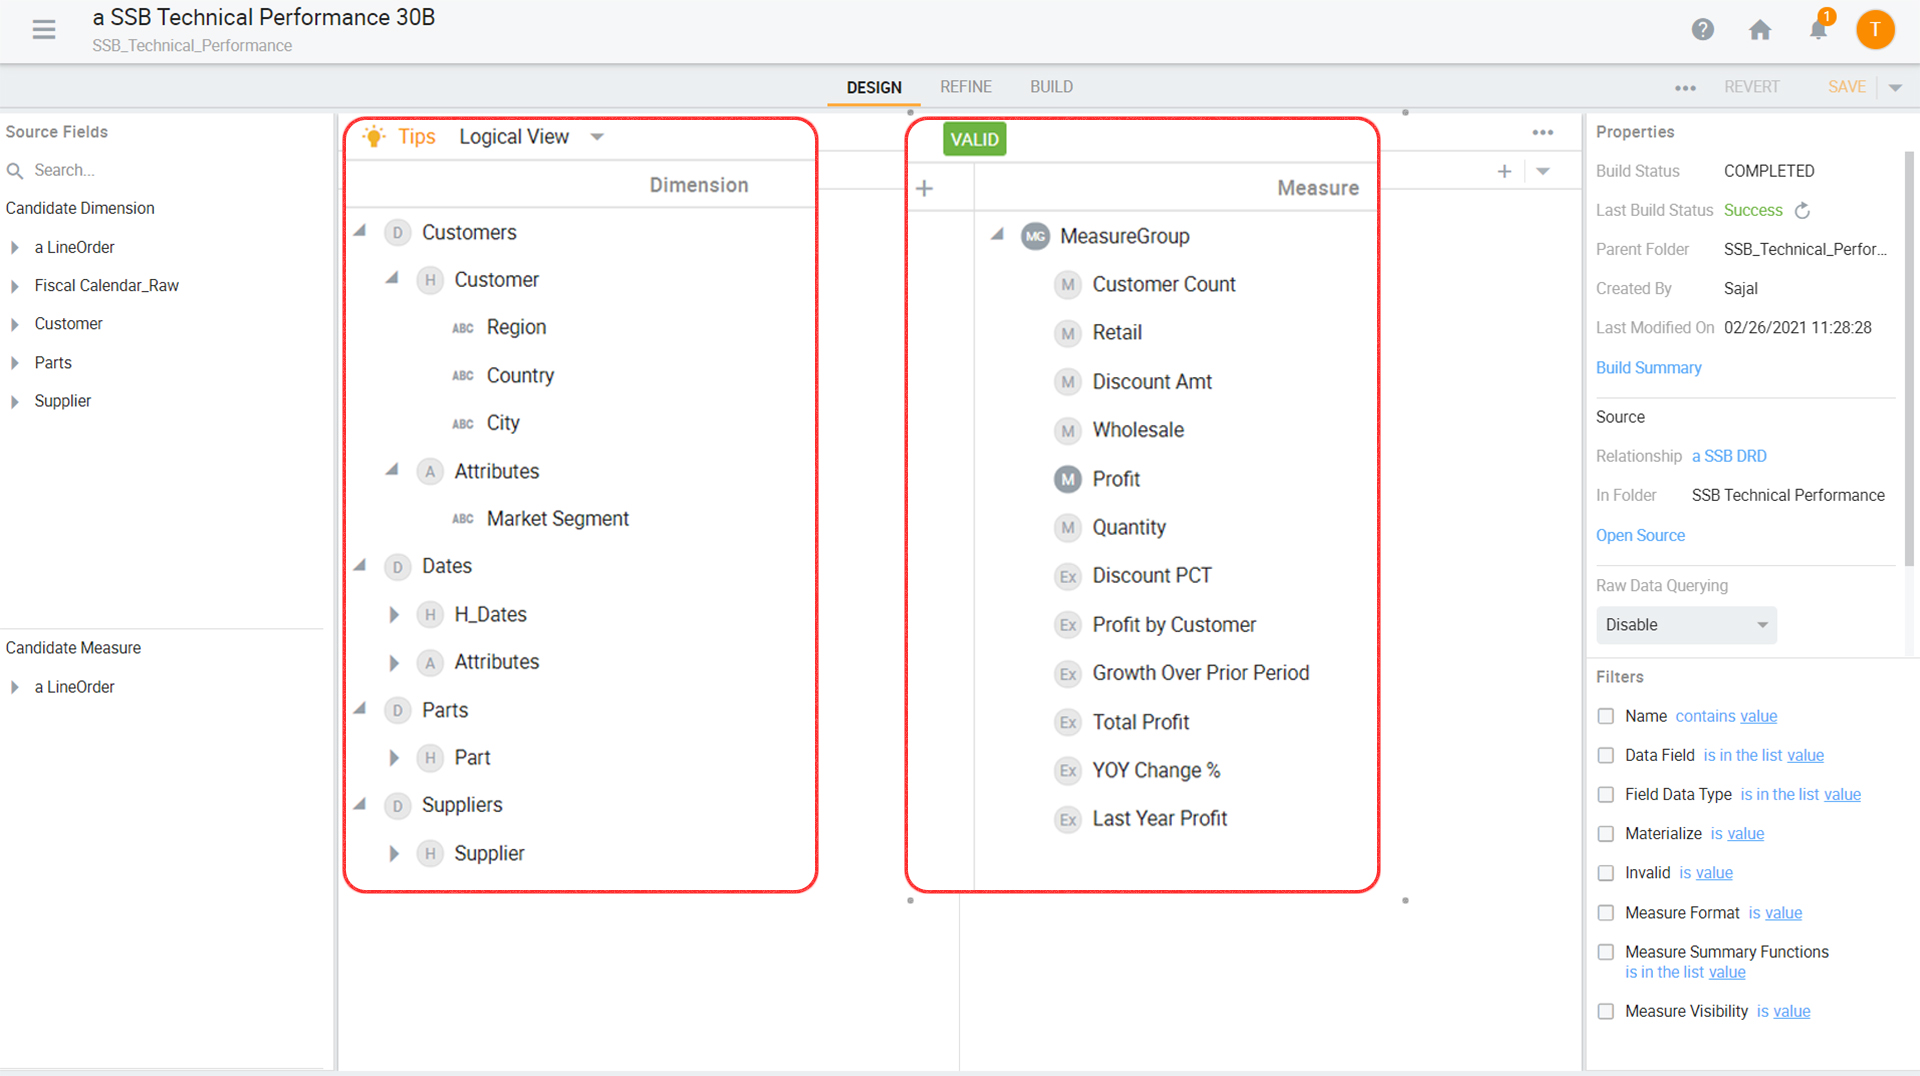
Figure 1.1 Defining the Semantic Model in the Kyvos cube.
Once defined. you can access the same model using various BI tools like Tableau, Power BI, MicroStrategy, Excel, or any other tool of choice, and get sub-second query responses on 30 billion rows. Next, it’s time to connect different BI tools.
MicroStrategy
To connect MicroStrategy to the Kyvos cube, you can use the custom Kyvos connector or a standard MDX connector.
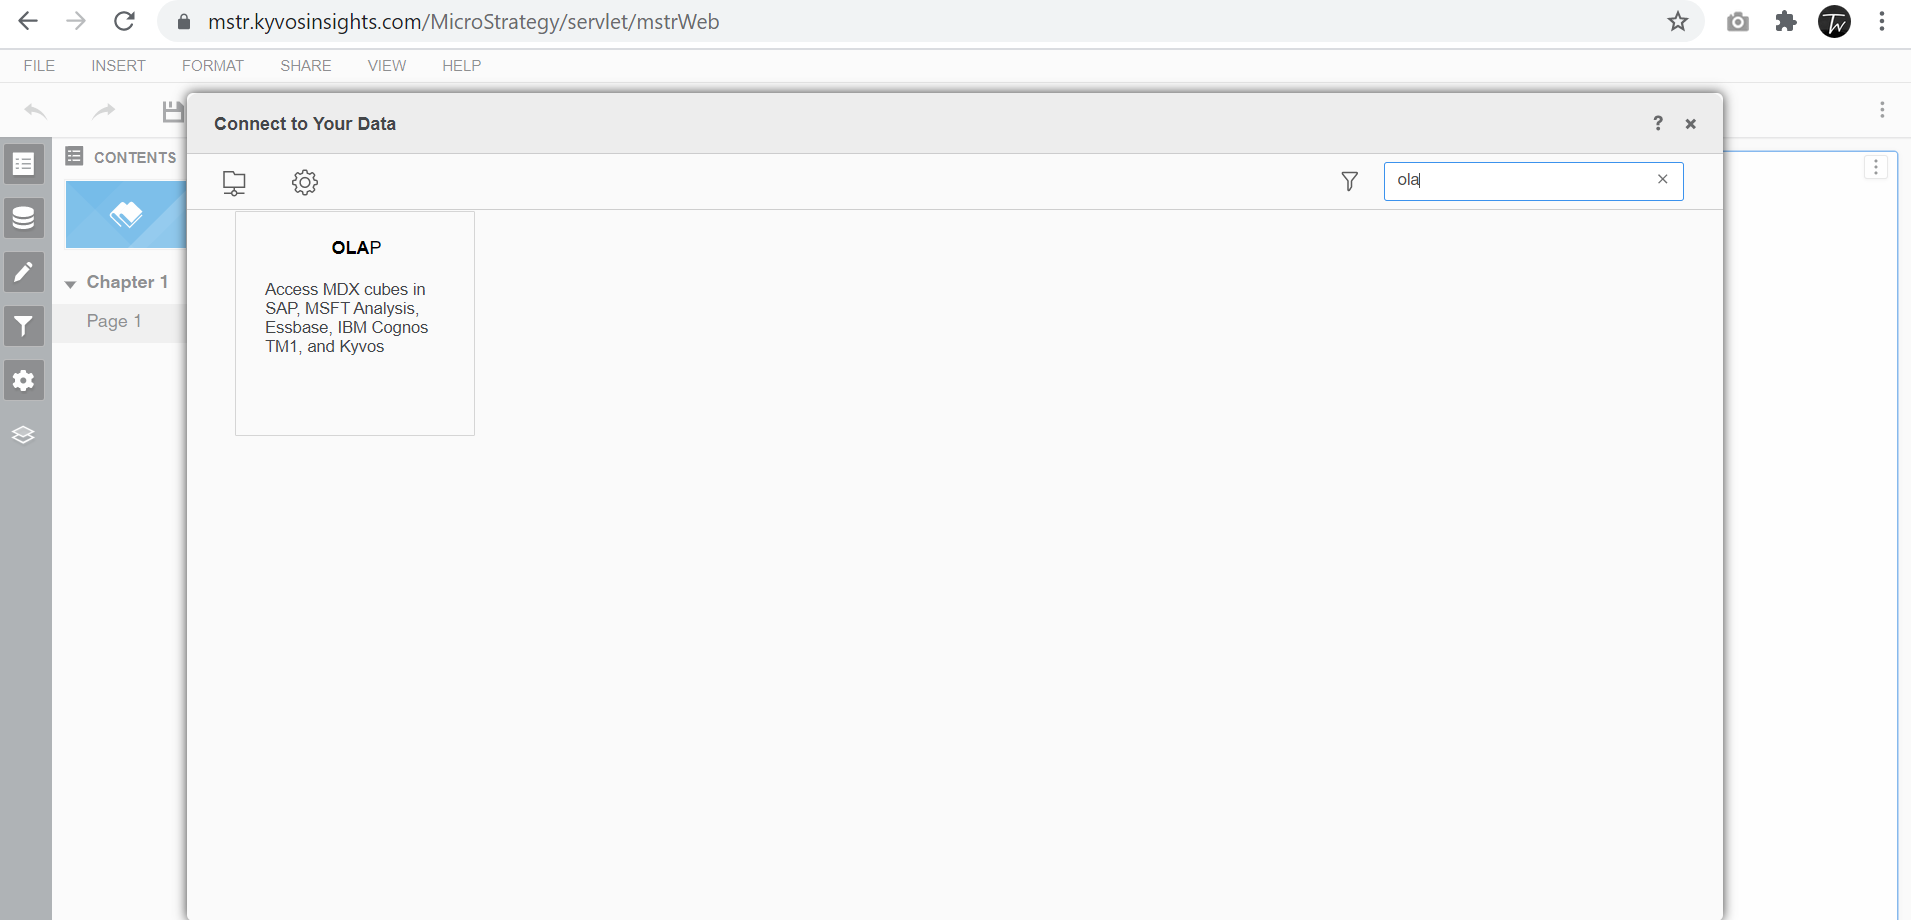
Figure 1.2 Creating a live connection between MicroStrategy and the Kyvos cube.
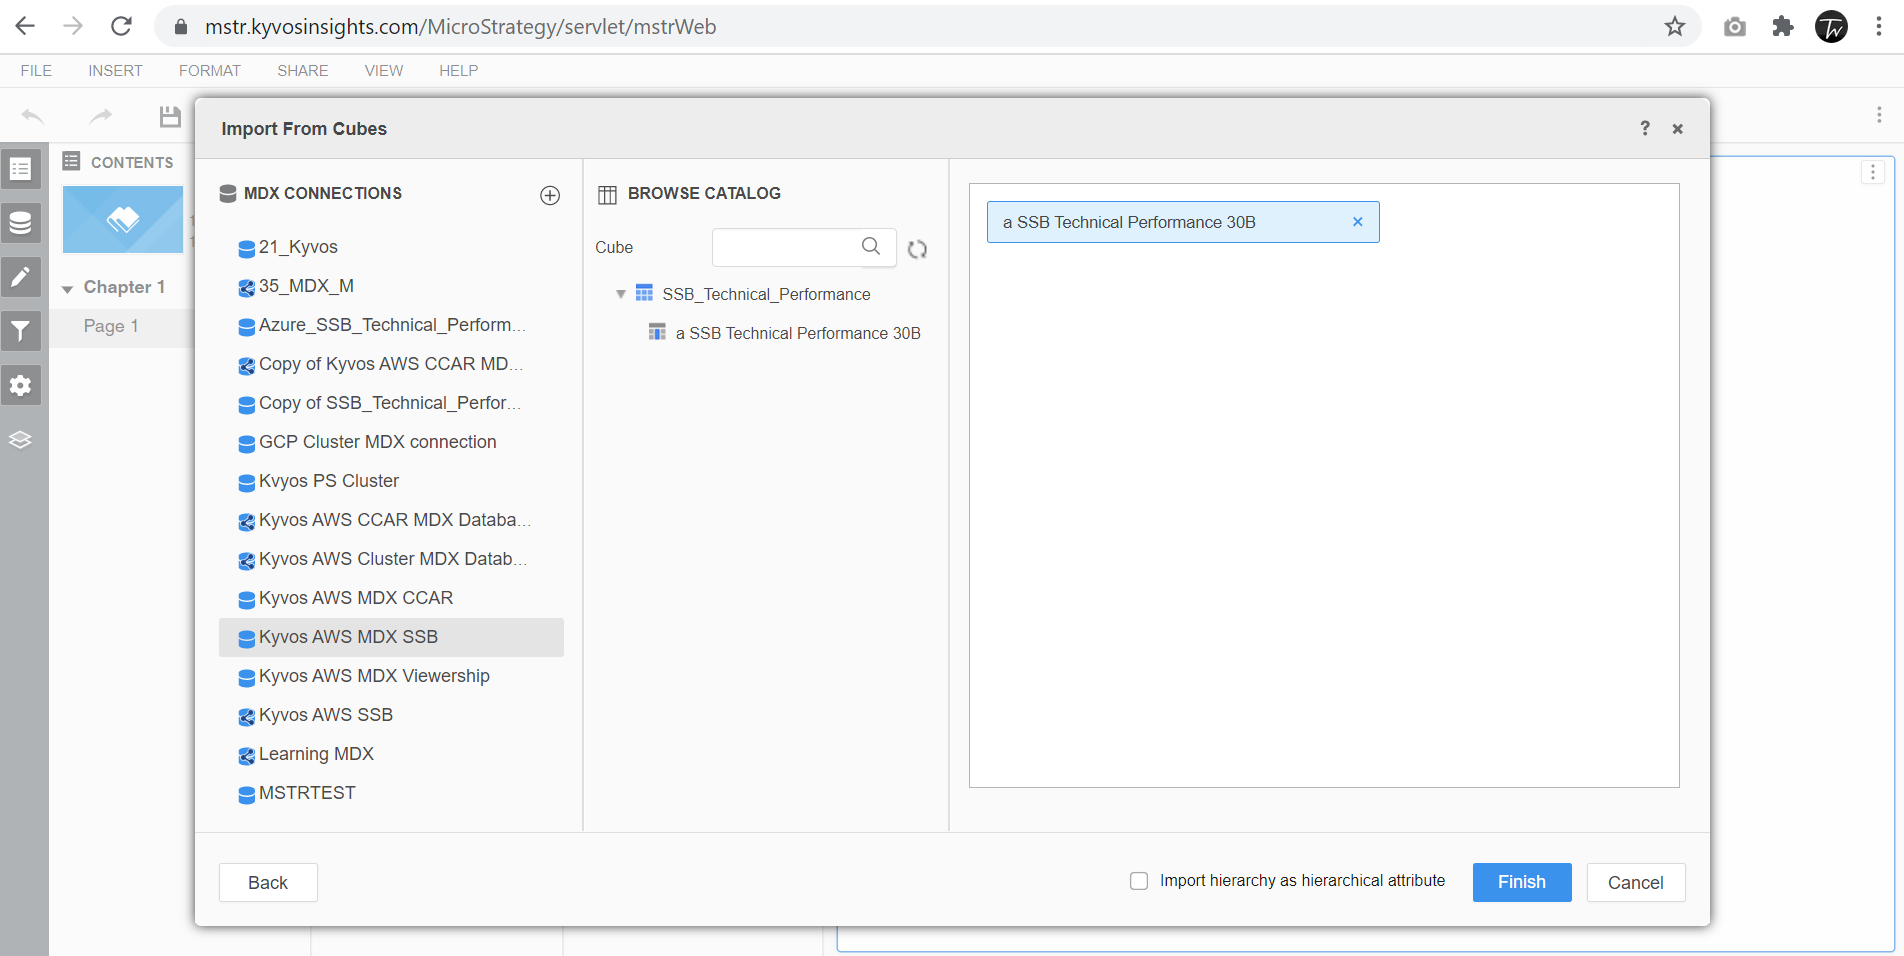
Figure 1.3 Selecting your cube to perform analytics on 30 billion rows.
Once you have made the connection, you can see the cube on your MicroStrategy interface. You can easily drag and drop dimensions and measures as needed into your visualizations and perform complex analytics on your data.
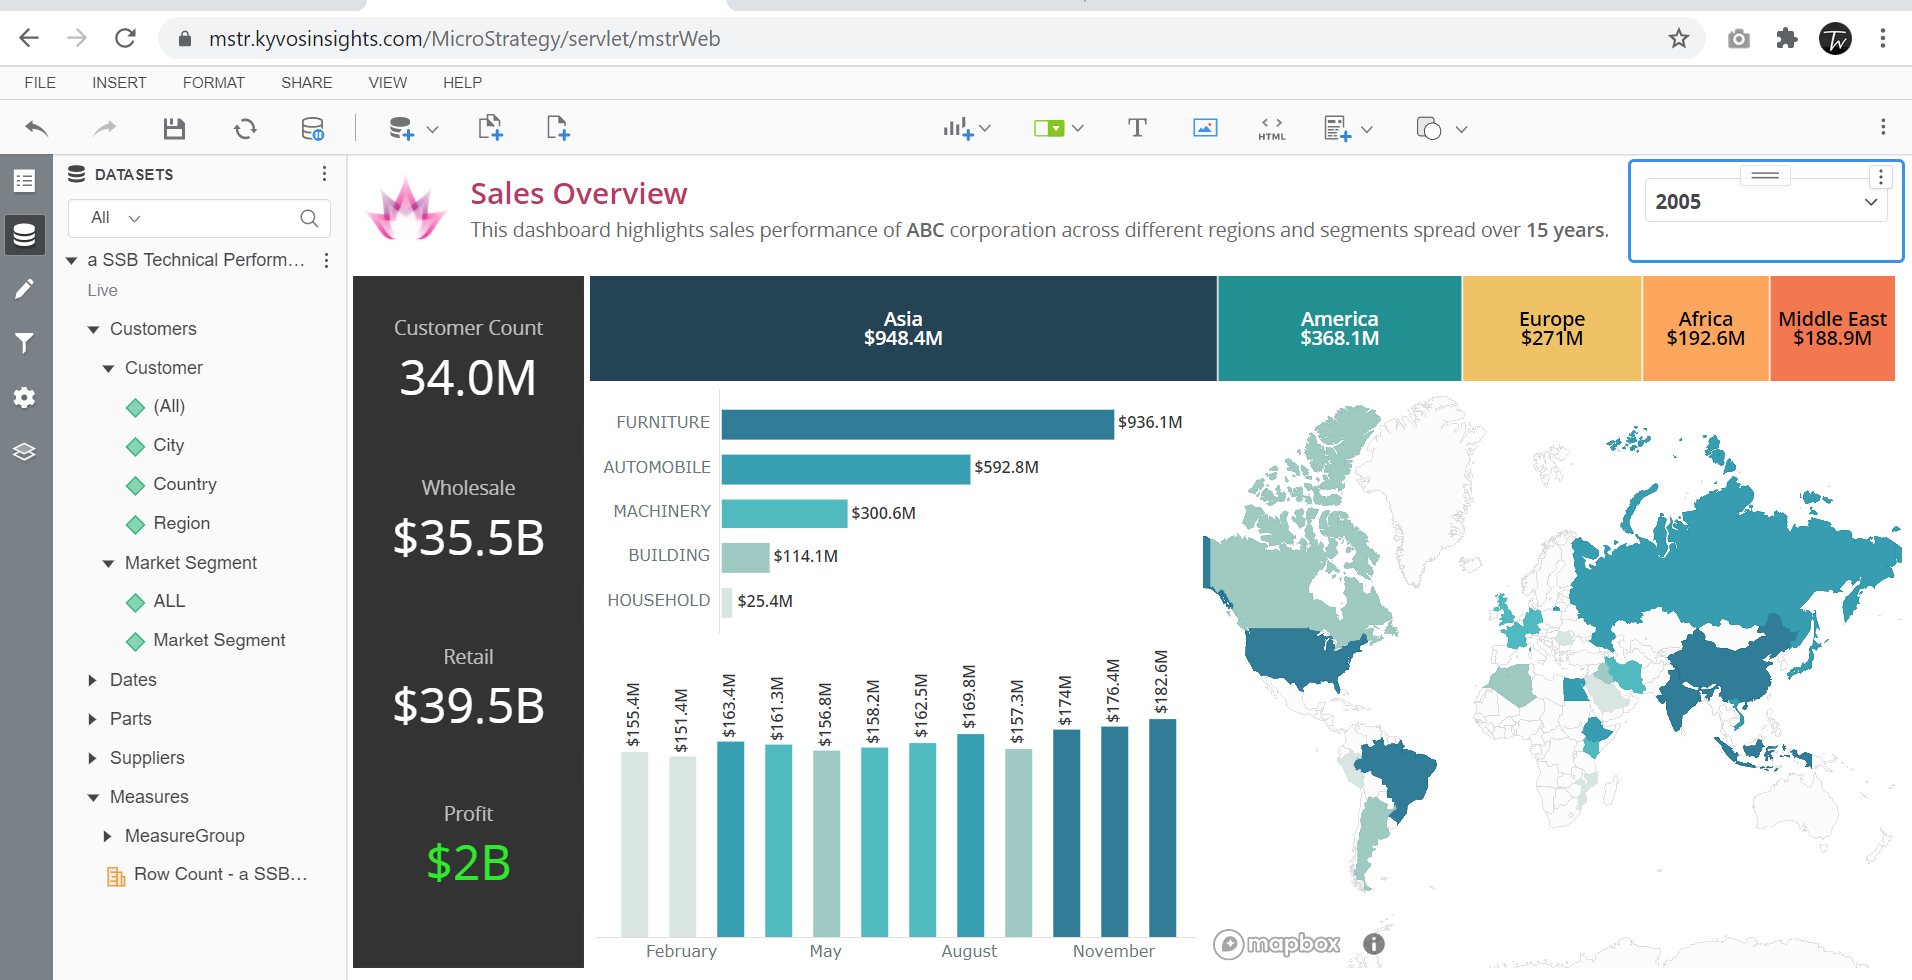
Figure 1.4 MicroStrategy dashboard that shows Profit (a calculated measure).
Tableau
Let us now see how you can access the same semantic model that was defined in Kyvos through Tableau. For this, first we need to connect Tableau to the Kyvos cube.
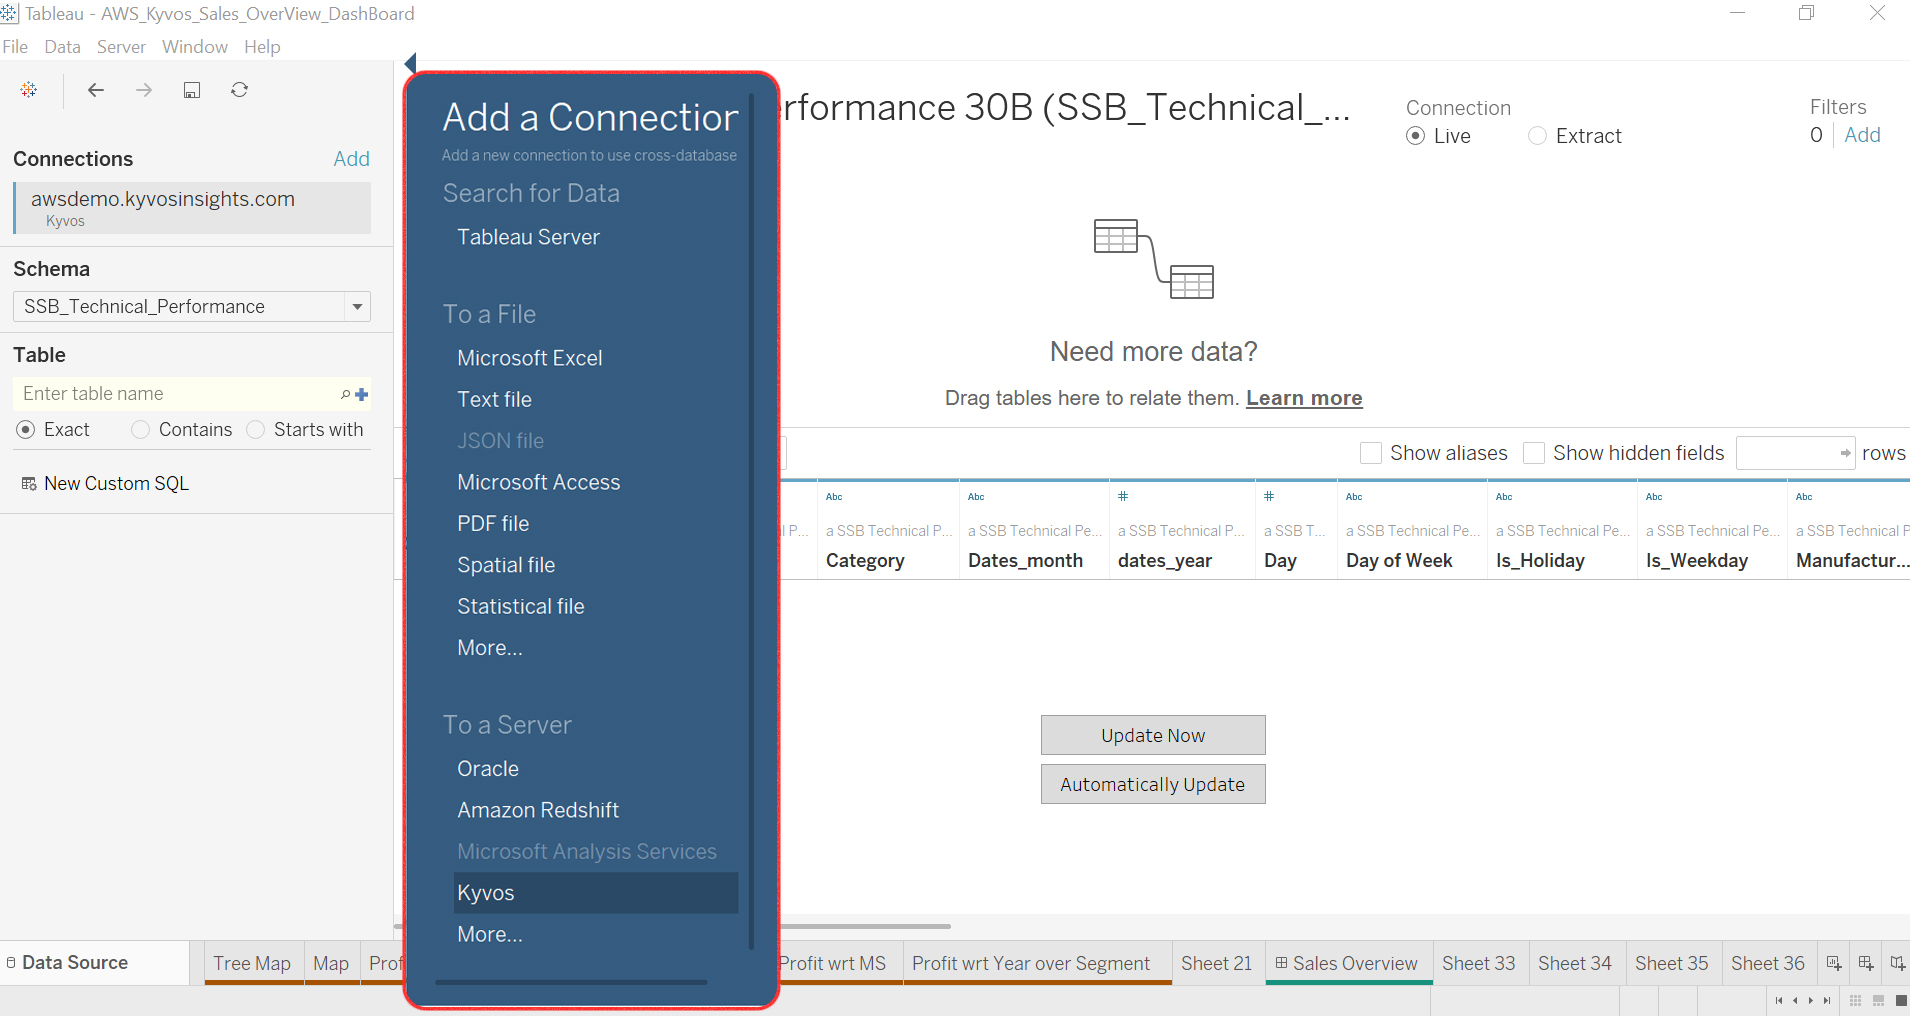
Figure 1.5 Creating a live connection between Tableau and the Kyvos cube.
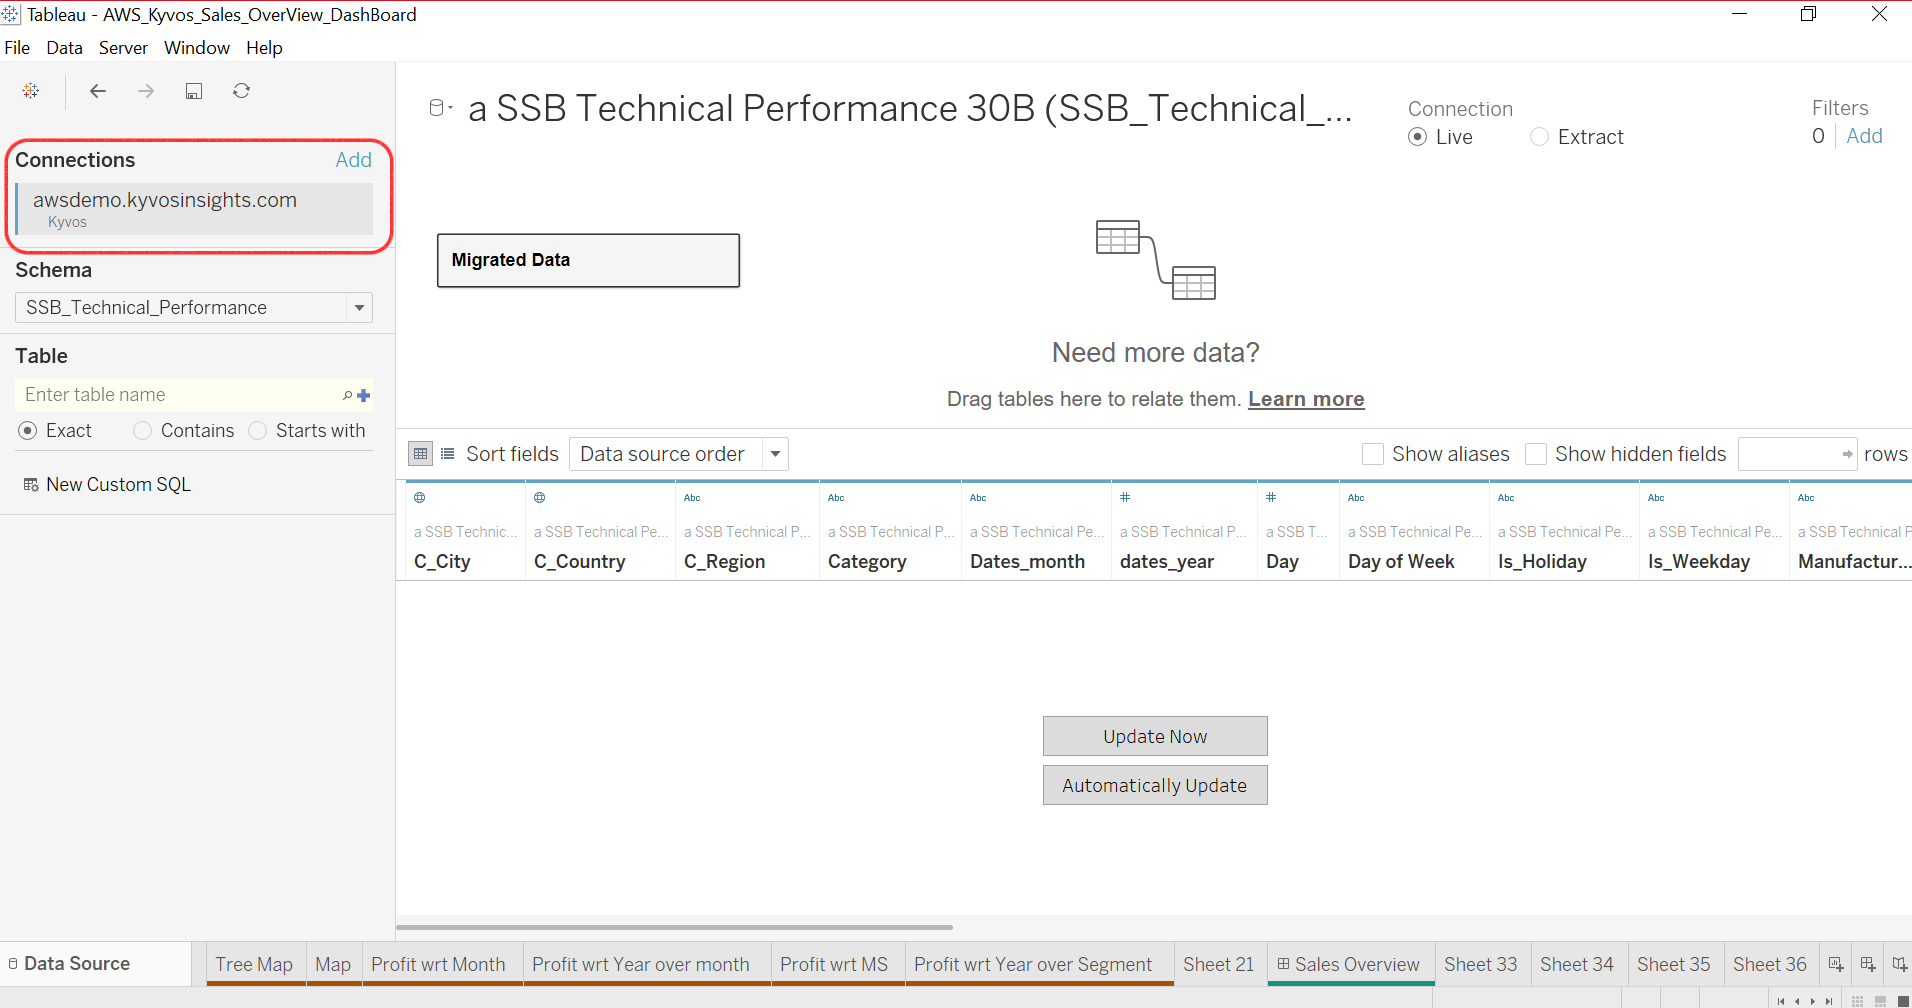
Figure 1.6 Selecting the dataset for analysis.
Once the connection is set, you can drag and drop dimensions and measures into your dashboards and create reports as needed. The best part is that you get instant responses on billions or even trillions of rows of data.
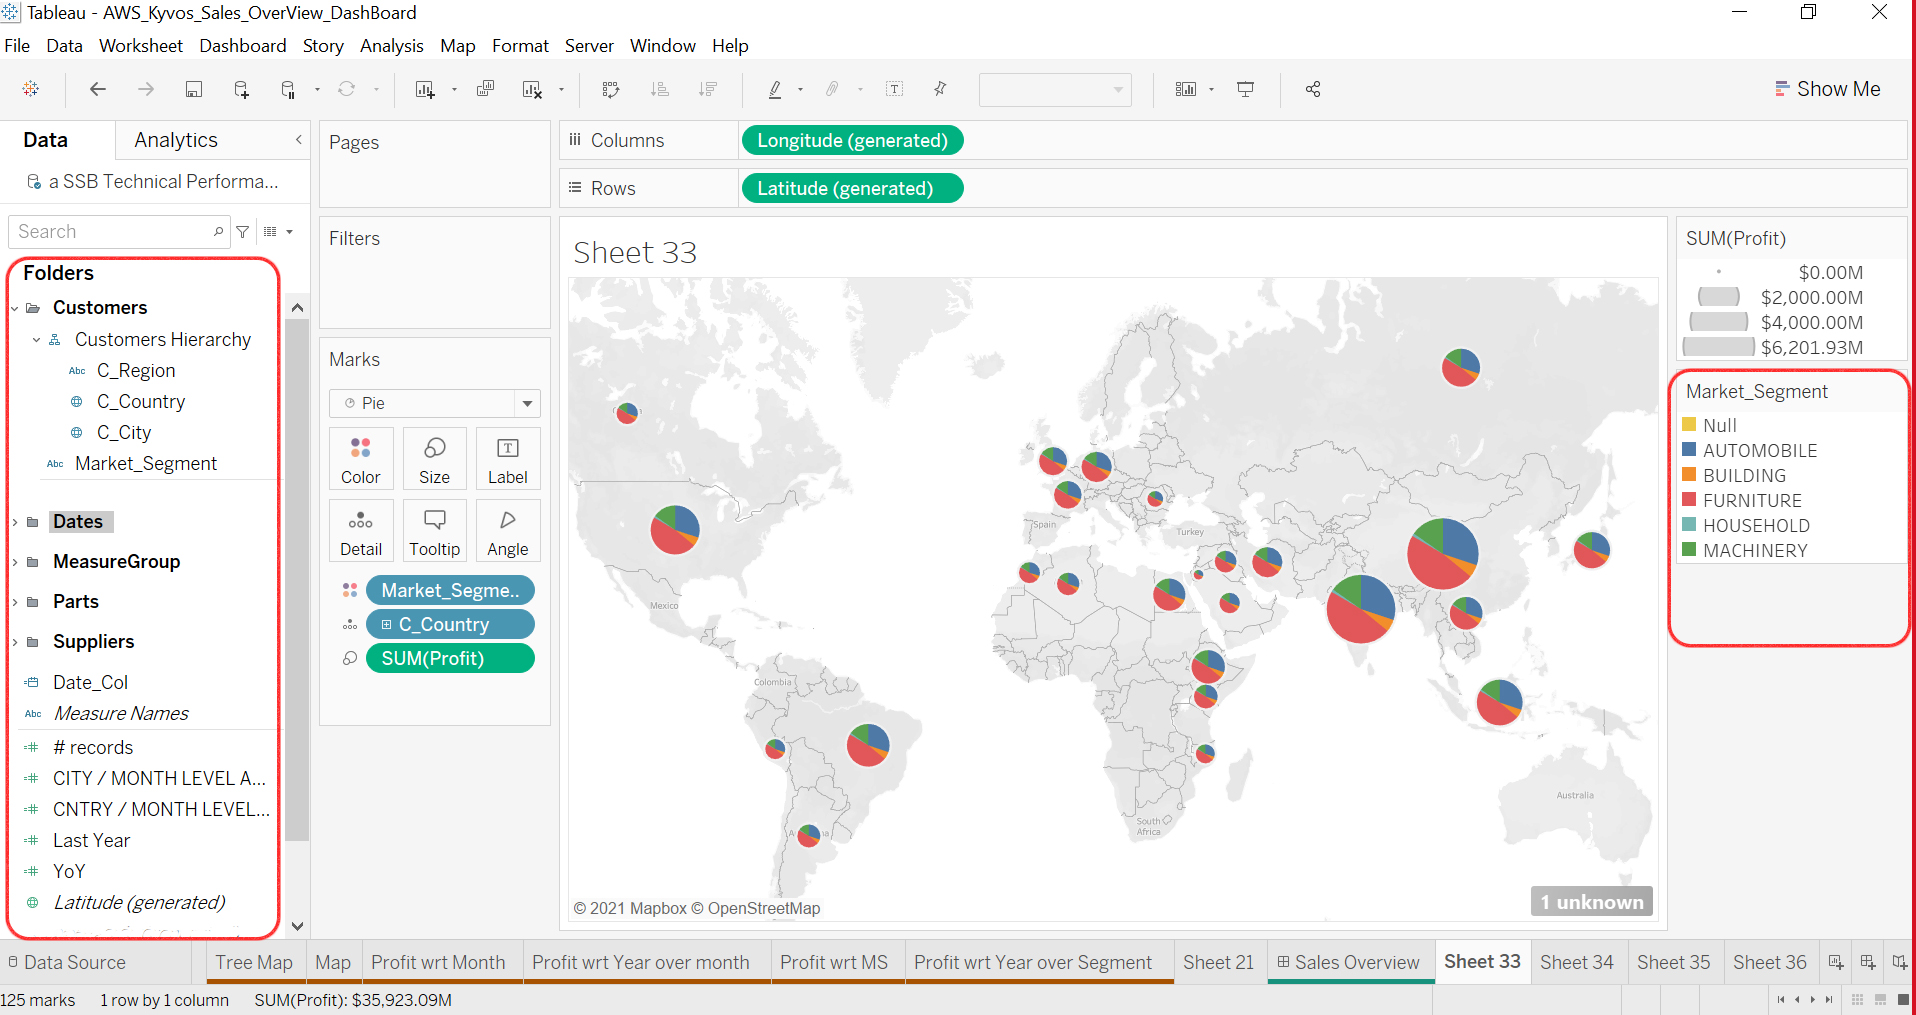
Figure 1.7 Tableau dashboard showing the sales of different regions, along with the ability to drag-and-drop dimensions and measures from the Kyvos cube.
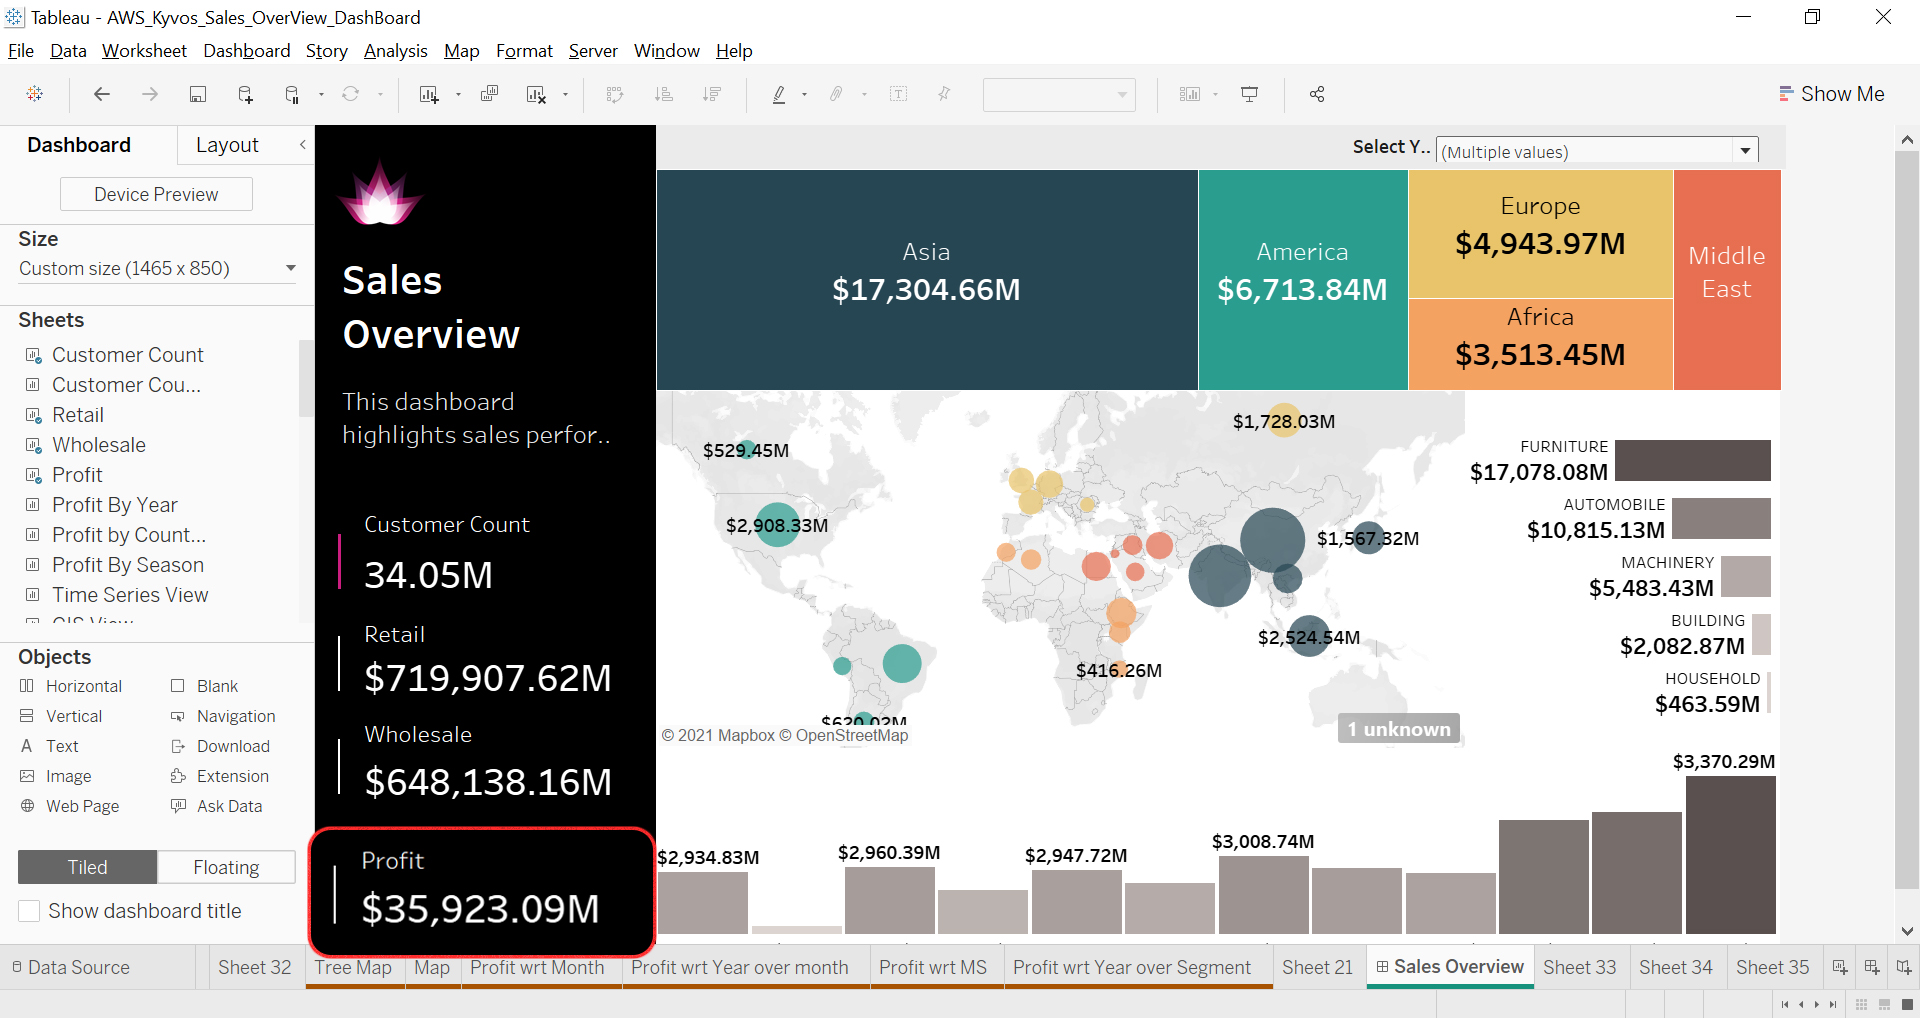
Figure 1.8 View of a Tableau dashboard that shows Profit (a calculated measure) for some selected filters.
Power BI
We’ll now repeat the same steps for Power BI and check how you can access the Kyvos semantic model. First, we need to create a connection from Power BI to the Kyvos cube.
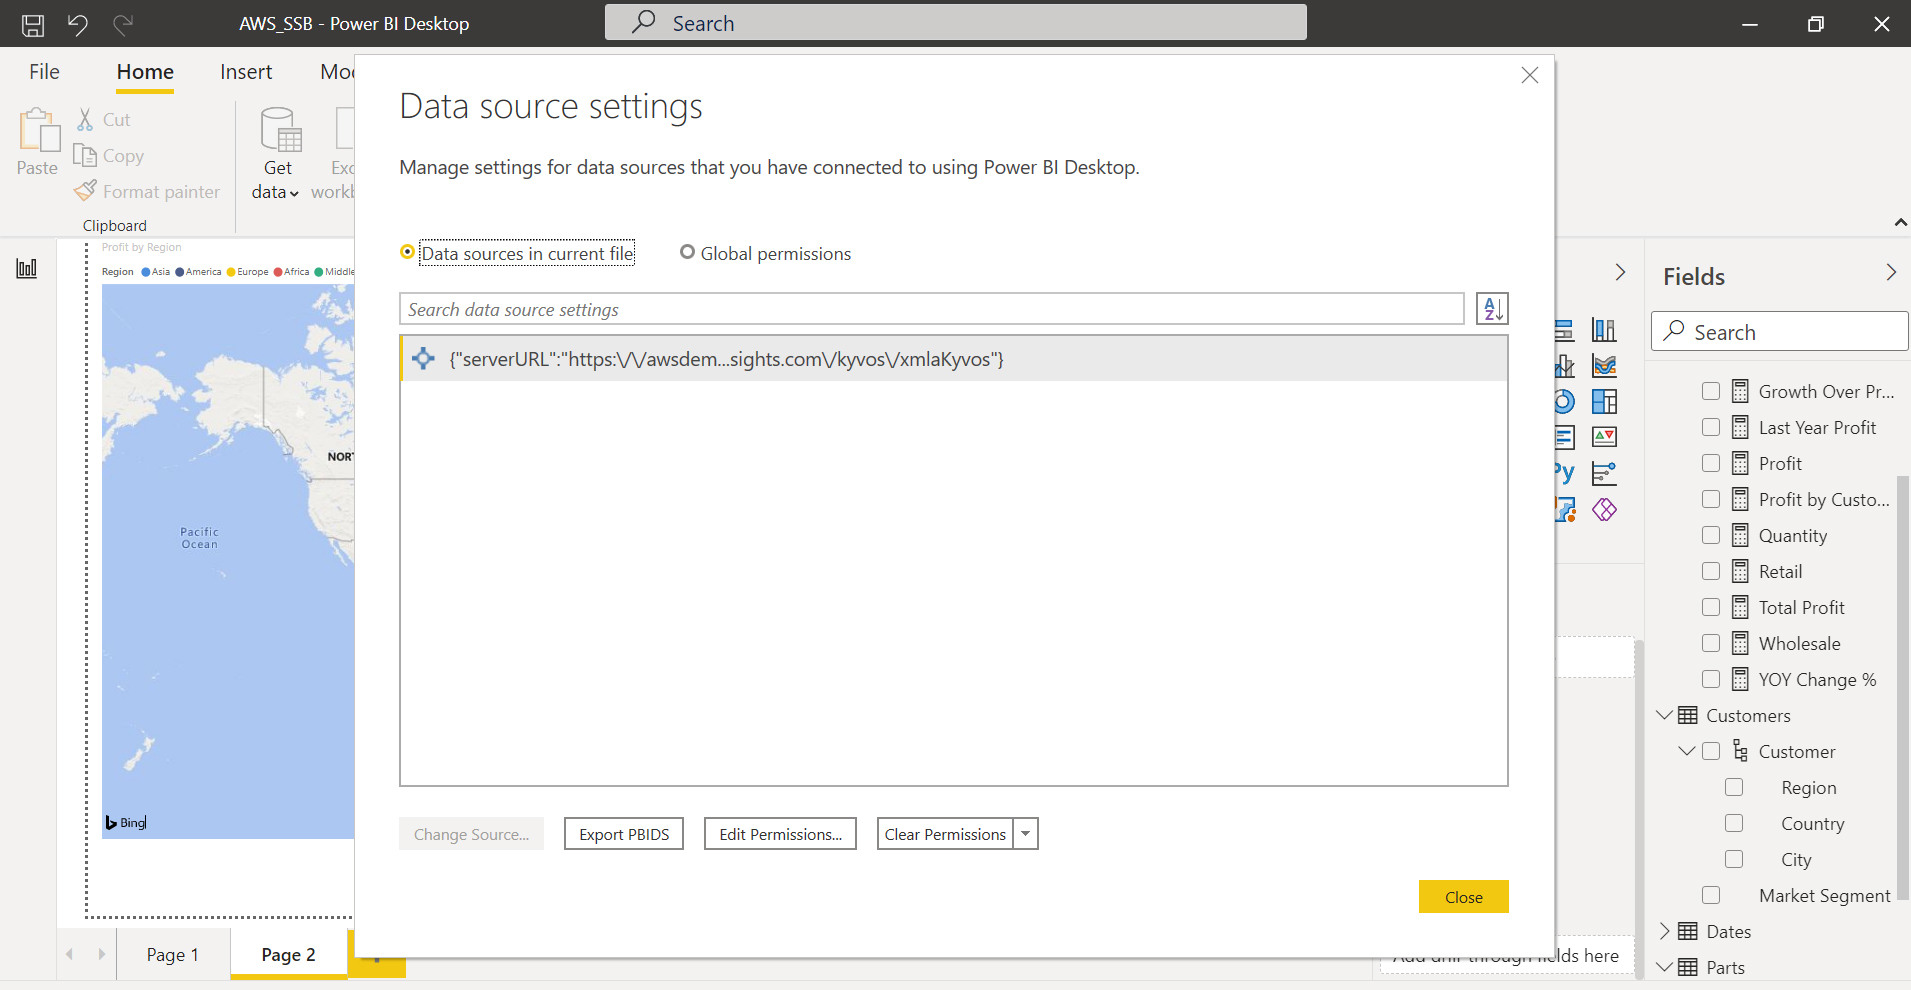
Figure 1.9 Creating a live connection between Power BI and the Kyvos cube.
Once done, you can access the same semantic model and create interactive reports on all the data.
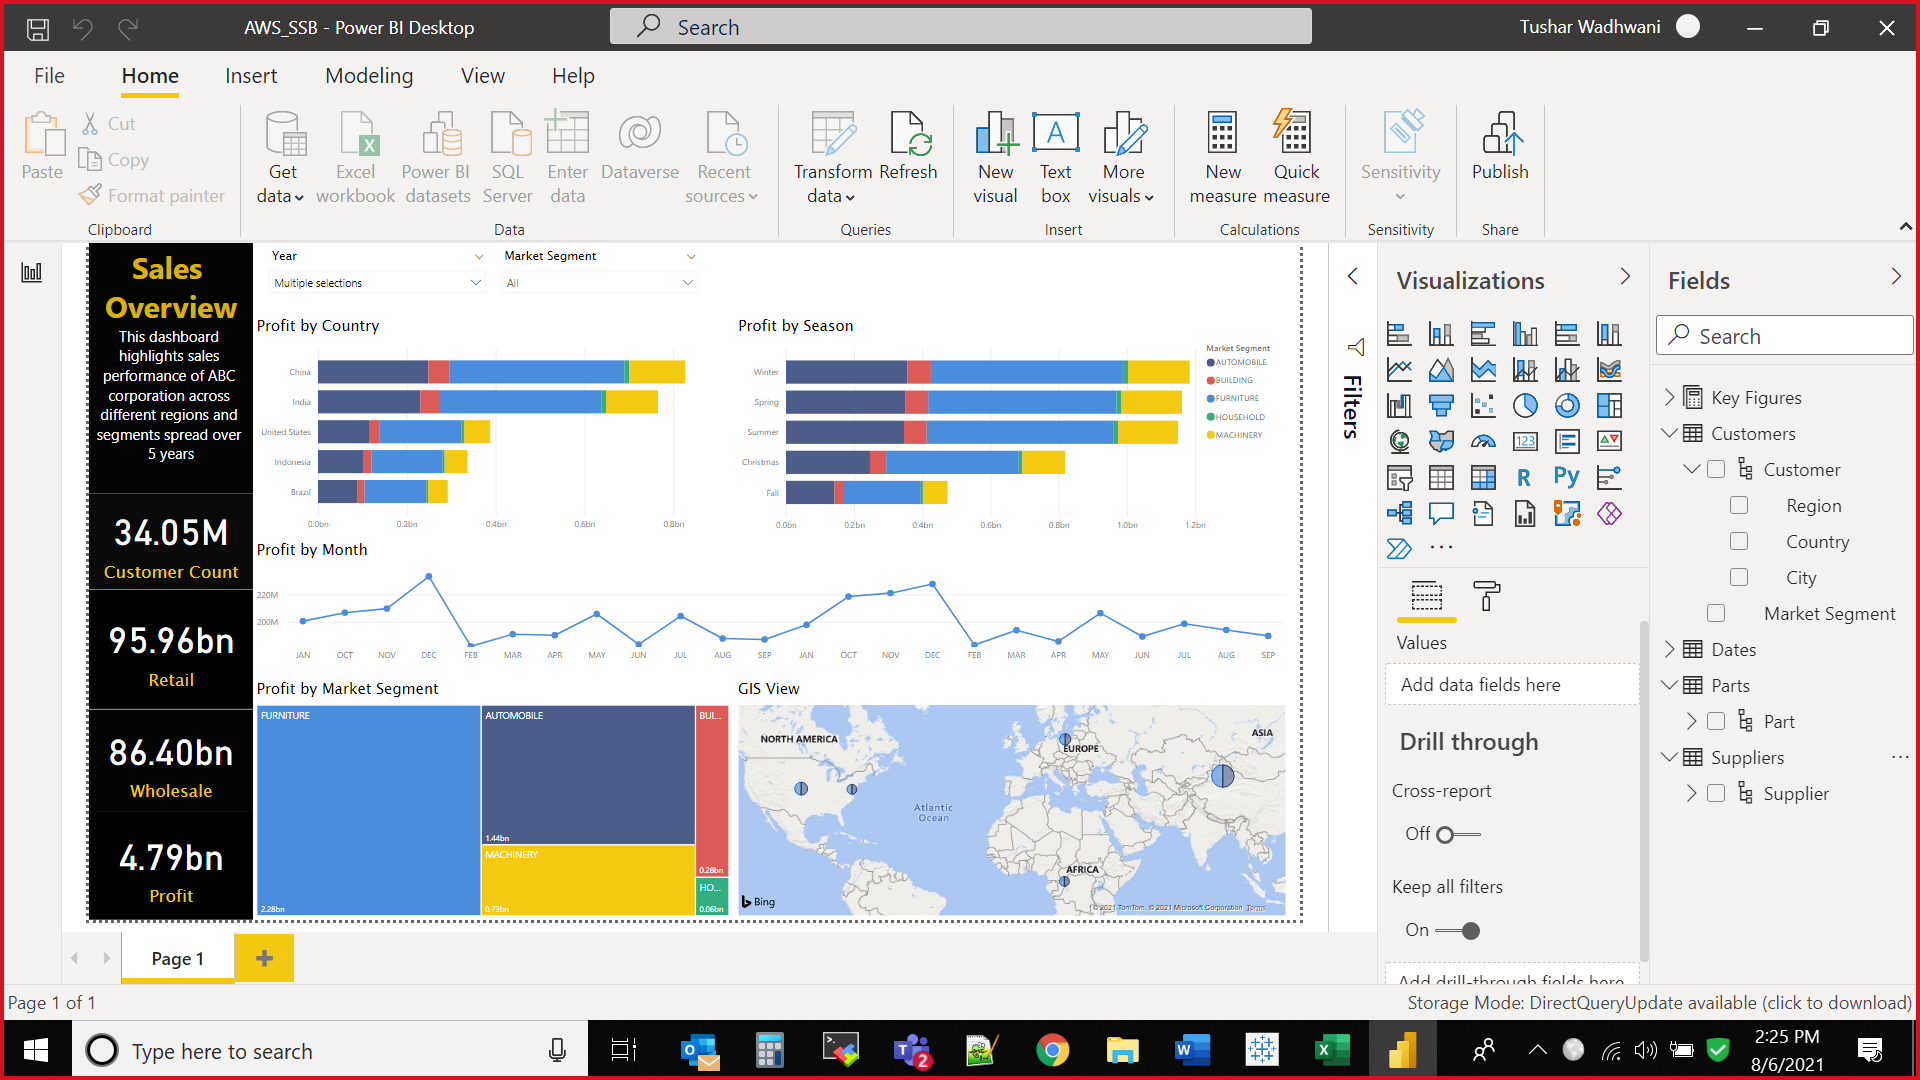
Figure 1.10 Power BI dashboard showing the profit of all regions. All the dimensions and measures defined in the Kyvos cube are also visible and can be easily added to the reports.
Excel
Just as we saw for other BI tools above, you can access the Kyvos semantic model through your Excel interface and analyze billions and trillions of rows of data with extremely high performance.
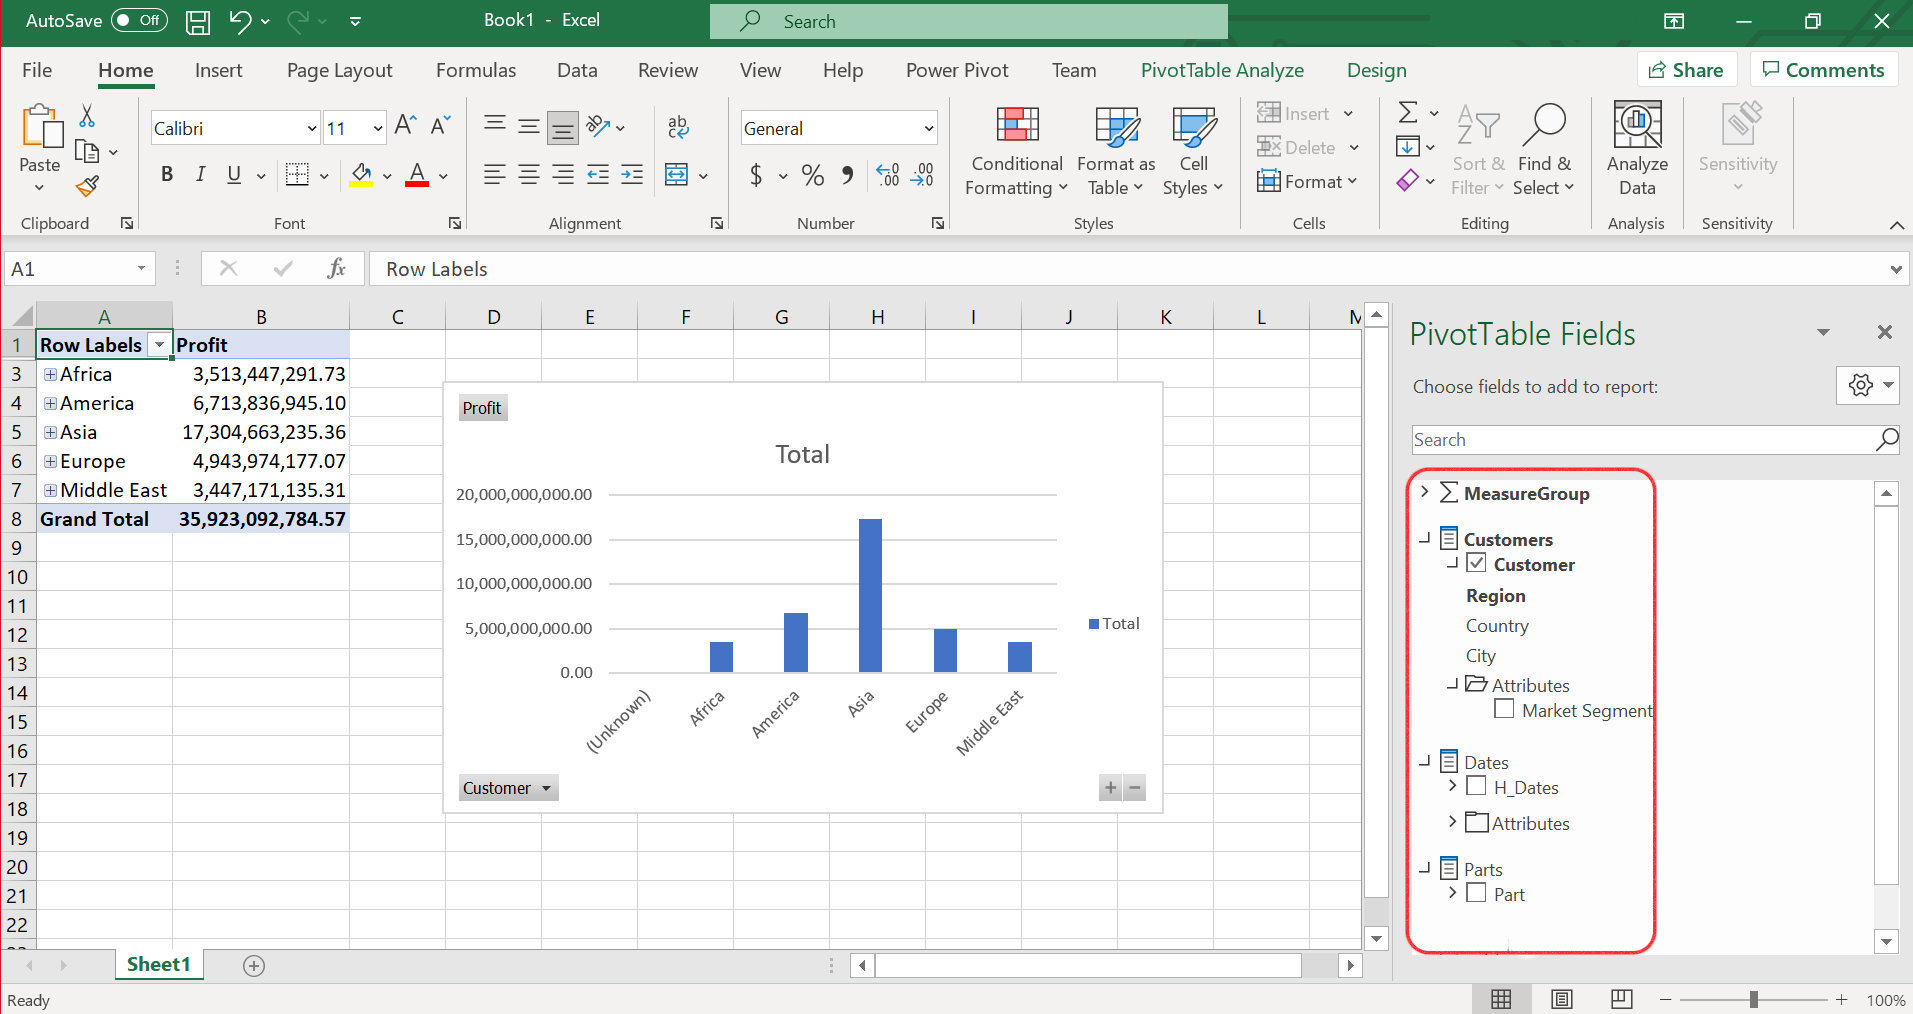
Figure 1.11 Excel dashboard showing region-wise profit. You can access the entire Semantic model through Excel with the capability to drill-down, slice & dice and perform analytics on 30 billion rows with instant response times.
In Conclusion
The above example represents a very simple use case and a comparatively smaller dataset. Kyvos, with its universal semantic layer, makes it easy for you to create a single consolidated view of extremely large datasets and complex business use cases that can be accessed across BI tools. Additionally, it accelerates BI tool performance on the cloud, simplifying analytics for users across your enterprise. Empower your business users with Kyvos to make better and faster business decisions. To learn more, get in touch with our team today!
